Just before Friday's close, crude oil was poised for a sizable weekly decline. Yet after Thursday's plunge, WTI seemed to have stabilized. But did it really? In this analysis we're going to take a closer look. We objectively reveal what to expect next. Either the bulls or the bears won't like it. Who do you think it'll be?

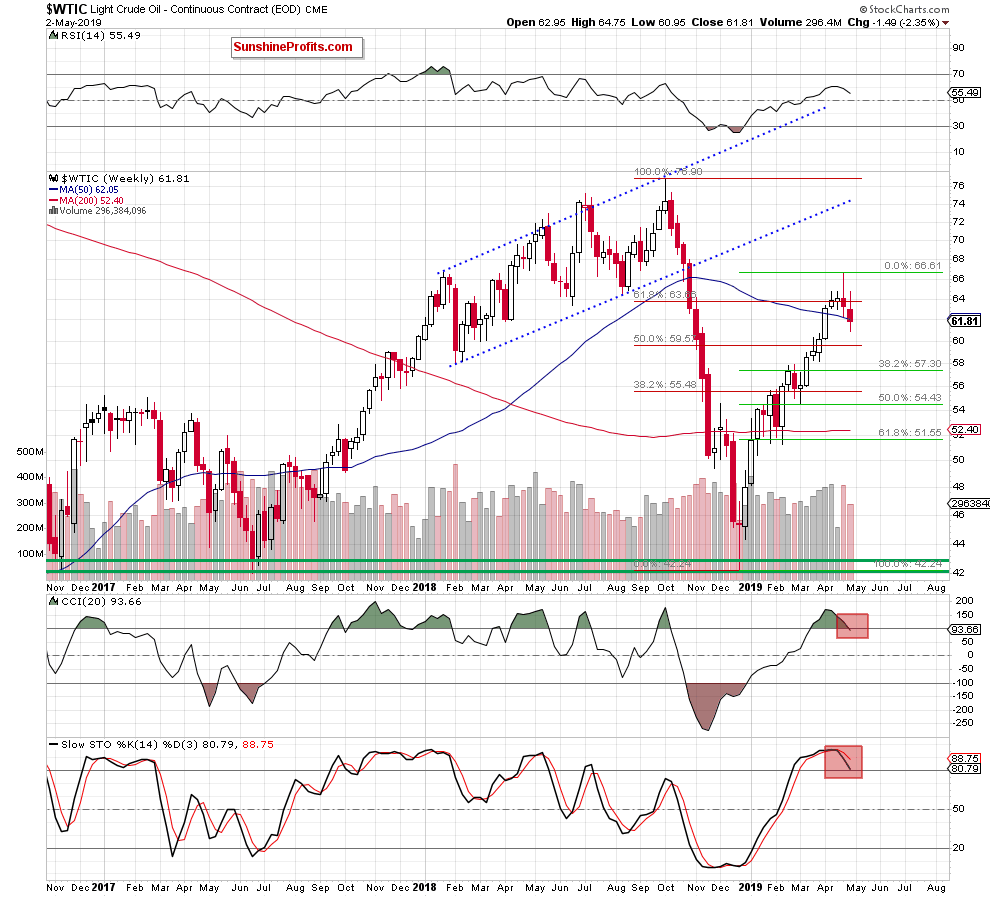
We'll start with the weekly chart above. Earlier this week, U.S. crude oil verified last week's breakdown below the 61.8% Fibonacci retracement – and that encouraged sellers to act and black gold slipped below its previously broken 50-week moving average.
If or when we close below that support, oil will head further south. It's worth noting that both the CCI and Stochastic Oscillator have issued sell signals; and those sell signals increase the probability of further deterioration in the coming week(s).

courtesy of stockcharts.com
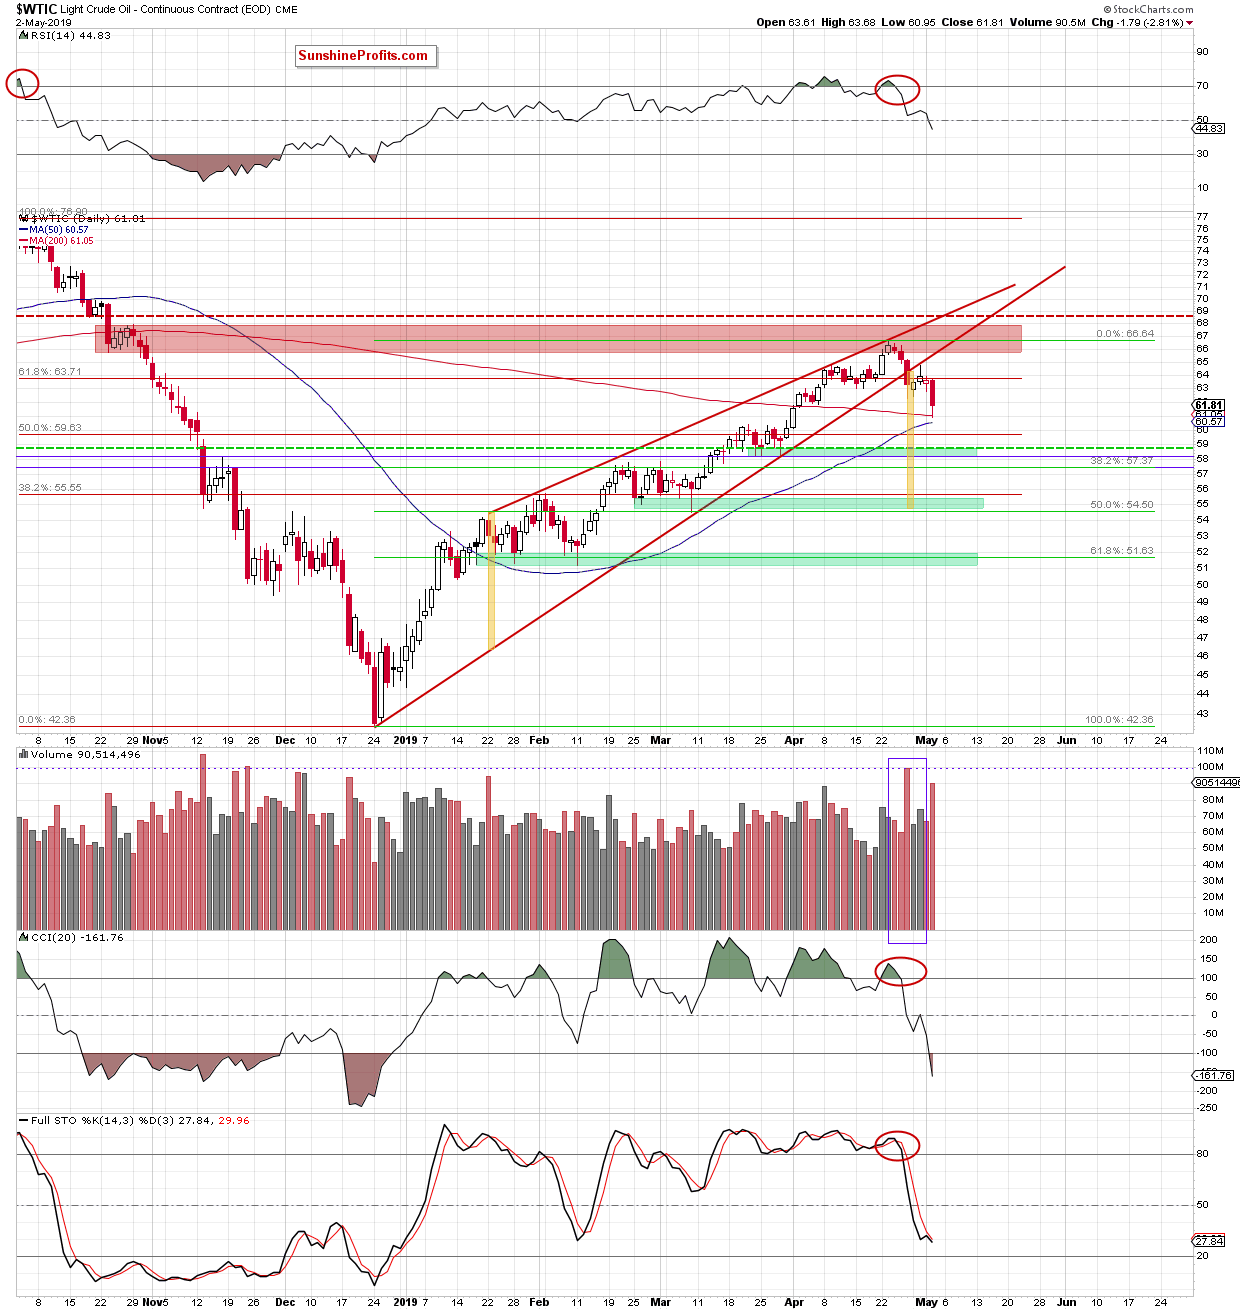
In Wednesday's alert, we noted that crude oil had verified its earlier breakdown below the lower border of the rising red wedge. We noted that this was a bearish development and that it was likely to translate into further deterioration.
Looking at the daily chart, we see that our expectations turned out to be correct. Black gold plunged below $62 but just before Friday's close, it had once again climbed back to that price point, making our short positions even more profitable.
Light crude has reached its 200-day moving average and that has triggered a tiny rebound. Tiny when compared to the preceding slide. The commodity, however, still closed Thursday's session below its mid-April lows, which suggests that lower prices are still ahead of us.
Bearish Volume Warning
Examining the volume for further clues reveals an interesting point. Thursday's volume was significantly higher than either of oil's preceding upswing days, reinforcing the bearish scenario. That's the same situation as we have had with last Friday's volume. And we remember where the price went next eventually.
How low could the commodity go? Take another look at Wednesday's Alert below, which seems every bit as up-to-date today:
(...) Taking into account the shape of the current decline, black gold could move even lower than the first green support zone. It could visit the second green support zone because there the size of the decline would correspond to the height of the wedge that the oil price has broken down from.
Summing up
The oil outlook remains bearish. Once its breakdown from the rising red wedge was verified, crude oil set sail south without really looking back. The increased volume on Thursday's downswing supports this interpretation. The weekly indicators (CCI, Stochastics) have generated their sell signals. The daily indicators are also on sell signals. The bearish divergences between the daily indicators and the oil price itself are receiving their downward price resolution.
The short position continues to be justified.
Thank you.
