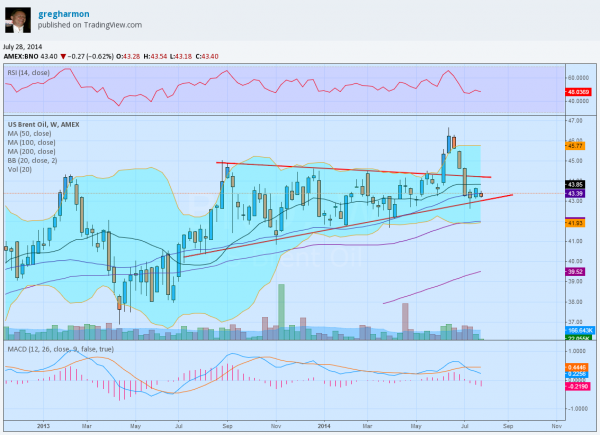
Crude Oil comes in two varieties, West Texas Intermediate and Brent. Here we mainly use WTI so you do not hear a lot about Brent. But through Europe it is big. The ETF for Brent, United States Brent Oil Fund LP (NYSE:BNO), is one way to follow it. The weekly chart below shows the price action over the last 18 months. Brent had built a symmetrical triangle over the last 12 months before the price broke above it in May. The breakout did not hold up though and failed short of the target of $49 by over $2.30. Since that breakdown it has falling back into the triangle and is now consolidating just over the bottom rail of the triangle. Many people see an ETF back in a range, but it also poses an opportunity.
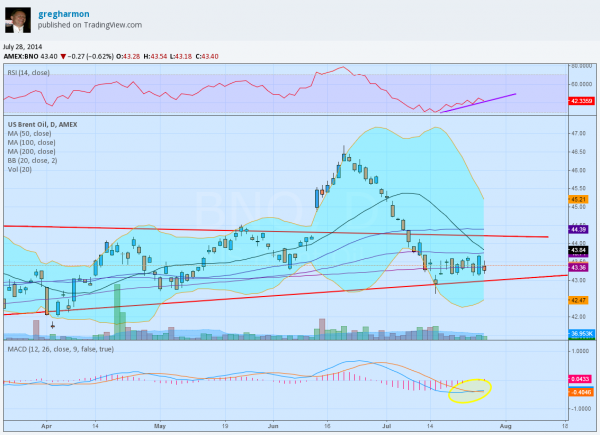
The sharp move lower can be described as a Three Black Crows pattern in Japanese Candlestick terms. This bodes for more downside and a Measured Move would target 40.25 lower. But it could also regroup and move back higher out of this base. That is where the daily chart is leaning. Notice below the MACD crossing up and the RSI trending higher on the daily chart. A move over 43.75 would trigger a long position.
So which one will it be, a gusher or a flood? I have no idea. Be prepared for either.


