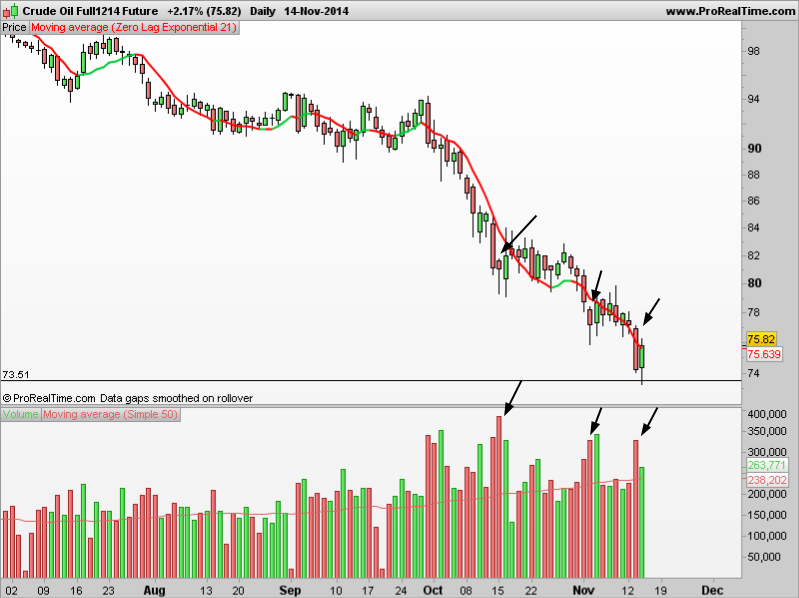
Crude oil (WTI) is near an old support formed at June/2012 (the same for Brent). It’s on a steep downtrend, which makes me be in a cautious stance, until there is at least a slight trend change. If prices reached at around $78 or if that exponential zero-lag moving average turns green for a significant amount of days, I consider that something might be changing. From a volume analysis point of view, I see institutional buying at those bars marked by the arrows – high volume, well above the average, with a reversal in prices right after. But in the middle of an avalanche, nobody can tell what’s going to happen.

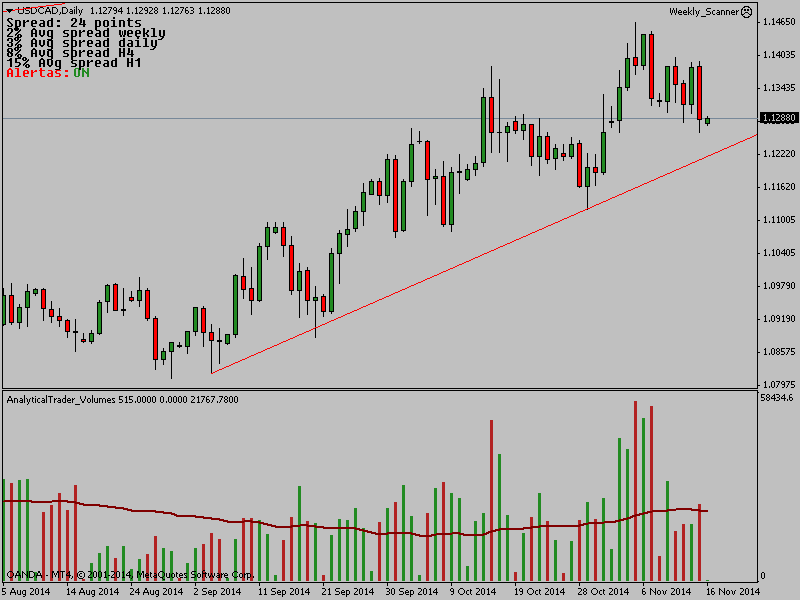
USD/CAD is a currency pair negatively correlated with oil. There is a clear up trendline, although those high volumes on the previous week clearly weren’t buying volumes. These are tick volumes, but are very highly correlated with real volumes in futures and forex, and different brokers show similar tick volumes. Prices stalled and even went down slightly after all that activity, which means large selling orders prevented the market from going further. What’s even more interesting is that in USD/CAD, there is no previous resistance at this level, which means this volume isn’t coming from locked-in traders waiting to get out at break-even, like it’s happening in WTI and Brent crude oil. And so this is a stronger sign than that of crude in my opinion.
The other difference to crude, is that here the trendline is the key support to be broken.

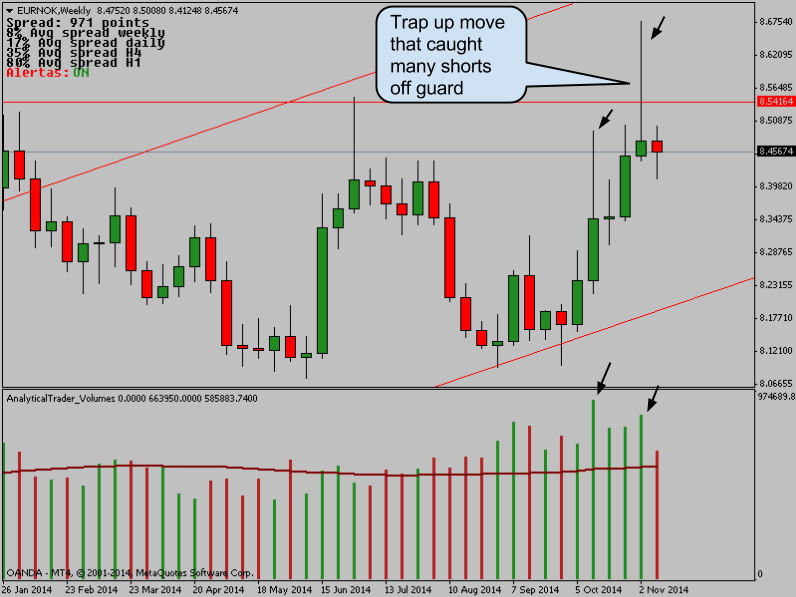
NOK is another currency highly influenced by the crude oil prices, as Norway is a big oil exporter. Again, the signs aren’t much different from crude and USD/CAD.
I’m going to be alert to what happens in crude in the next weeks, before making a trade decision. A break of that trendline in USD/CAD, and given the supply signals behind, would be a good sign that the general trend in crude is really changing.
