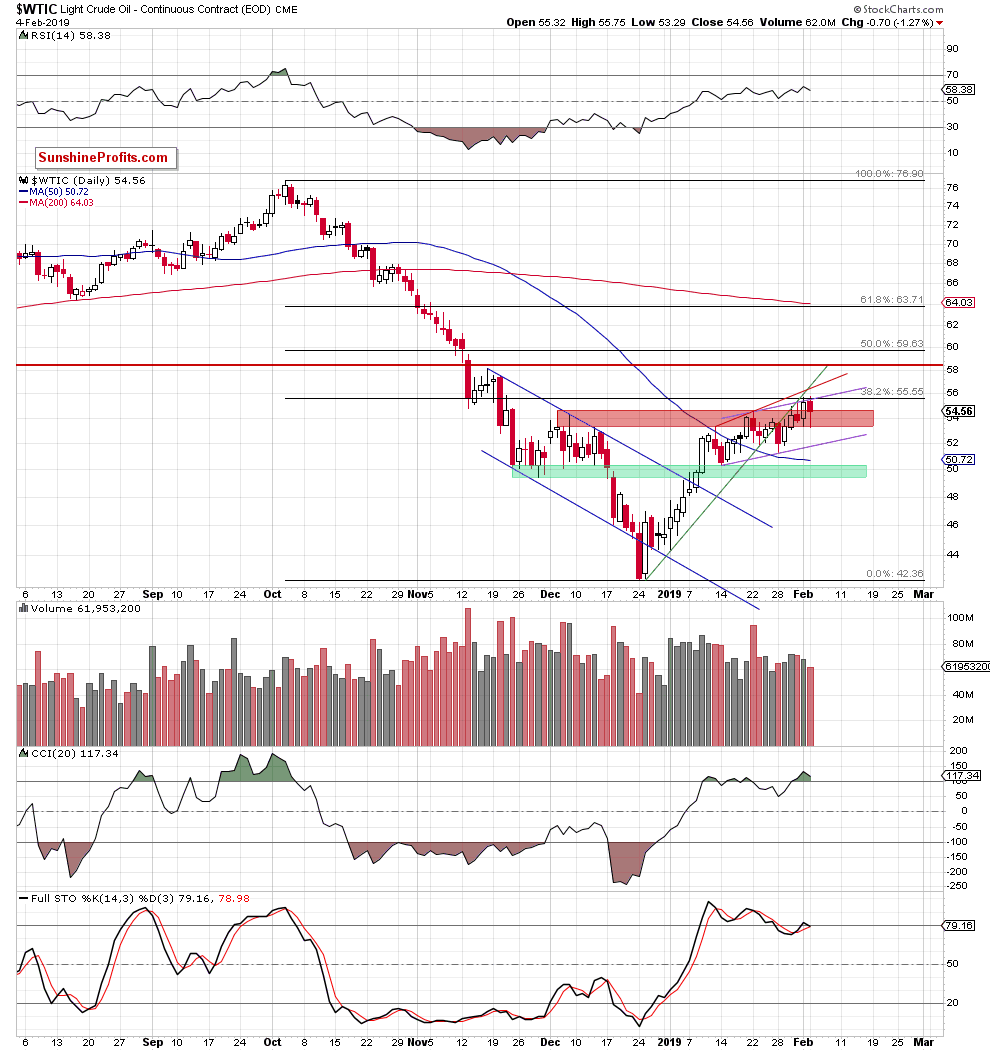
On Monday, crude oil saw a good attempt to move to the downside. The sellers were partially rebutted. How did the big picture stand the test and what are we to do about it?
Let’s examine the chart below.

Courtesy of stockcharts.com
Monday's crude oil increased a bit after the market’s open and hit a fresh January high – on an intraday basis, that is. The combination of the 38.2% Fibonacci retracement and the upper line of the purple rising trend channel stopped buyers for the third time in a row. The price reversed down and even if it ended the day way off the lows, it was still a clear down day. In the near future, we are likely to get more confirmation of the approaching move down in the form of higher accompanying volume, which would represent more of a conviction of the sellers.
Black gold closed the day slightly below the upper border of the red consolidation based on the December peak. We can read this as invalidation of the earlier breakout, which is a bearish development. This is further underlined by the Stochastics Oscillator ready to flash its own sell signal.
Targets
Recent observations featured in our Oil Trading Alerts remain up-to-date. The odds favor a move to the downside. At a minimum, we are likely to see a drop to the lower border of the purple rising trend channel in the very near future. If this support doesn’t hold, the next downside targets would be the 50-day moving average (currently at around $50.72) and the green support zone around the $50 mark.
Thank you.
