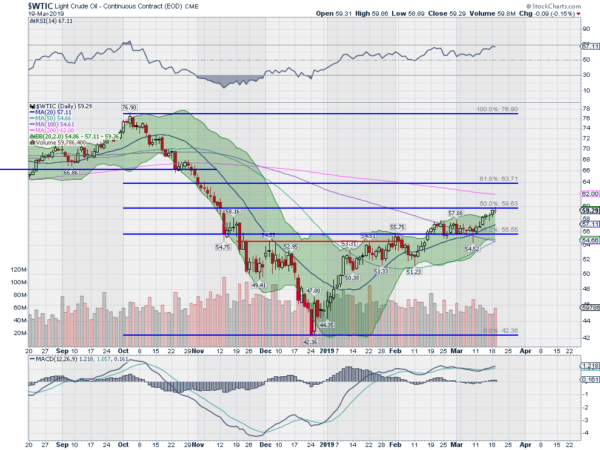
Crude oil started to drop in price at the beginning of October. It continued lower to a bottom Christmas Eve, just like the stock market. And since then it has continued to move higher. Tuesday it touched a 50% retracement of the move lower and printed a doji candle, signaling indecision. Does it have more in the tank?
The march higher certainly has not been a steep run up in price. So the momentum indicators have not been anywhere near overheated. The RSI is strong in the bullish zone with the MACD starting to move up again and positive. These both support more upside. The Bollinger Bands® are also opening as price rides the upper boundary higher.

The next level of significance for Crude Oil would be the 61.8% retracement at 63.71. This would put the price over its 200 day SMA for the first time since October. And if recent history holds that bodes well for the stock market. The price action in Crude Oil has mirrored that of stocks since October. That does not mean it will continue but it is an area to watch.
Disclaimer:
The information in this blog post represents my own opinions and does not contain a recommendation for any particular security or investment. I or my affiliates may hold positions or other interests in securities mentioned in the Blog, please see my Disclaimer page for my full disclaimer.
