Crude oil prices gushed higher at the start of 2016, rising from a low near $25 to over $50 per barrel in just 3 months. Following that May top, the price fell back and then readdressed the $52 area. It did this several times from May through November, making higher lows process each time. This set up an ascending triangle and crude oil prices broke above the triangle in early December. This set up a target on a technical basis to about $63. So what has happened since that break out? Nothing. It is just relaxing.
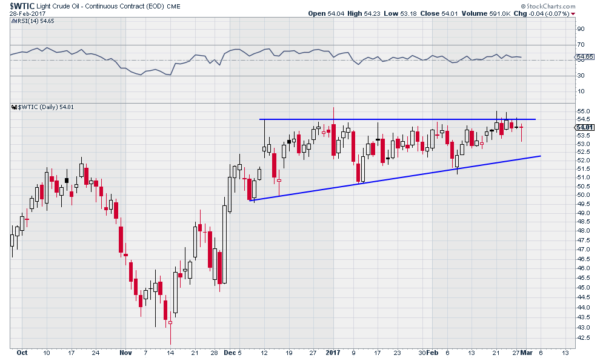
Well, not exactly nothing. The price of crude oil has held above the break out level around $51.50. That is a positive. But it has stayed in a very tight range. In fact it is building another one of those ascending triangles. The chart below shows a new resistance, or top of the triangle at about $54.50 and the characteristic set of higher lows as it tightens in consolidation. A break of this triangle to the upside would give a target to just over $59.

As I write, the price is touching the top of the triangle for the third time, often a break out point. But momentum is lagging. It remains bullish with the RSI holding over the mid line. But you can see it has just been moving sideways, like the price, for over 2 months. I am told that the commitment of traders data shows record net short positions. If this is true then holding over 51.50 is truly impressive. From the narrowness of the price action it seems that soon we will find out if those short bets pay off or if crude oil finally breaks to the upside. Which are you prepared for?
The information in this blog post represents my own opinions and does not contain a recommendation for any particular security or investment. I or my affiliates may hold positions or other interests in securities mentioned in the Blog, please see my Disclaimer page for my full disclaimer.
