Crude oil bulls proved weaker and the strength they attempted to project Thursday, evaporated to a considerable degree. Neither Friday, they appear any stronger. Given the rising geopolitical tensions in the Middle East, one could expect a stronger performance. Additionally, OPEC and Russia appear to be close to agreement on their oil supply coordination. Turning to the question on everyone's mind - is the hope for higher oil prices lost?
Let's take a closer look at the chart below (first and third chart courtesy of http://stockcharts.com , the second one courtesy of www.stooq.com ).
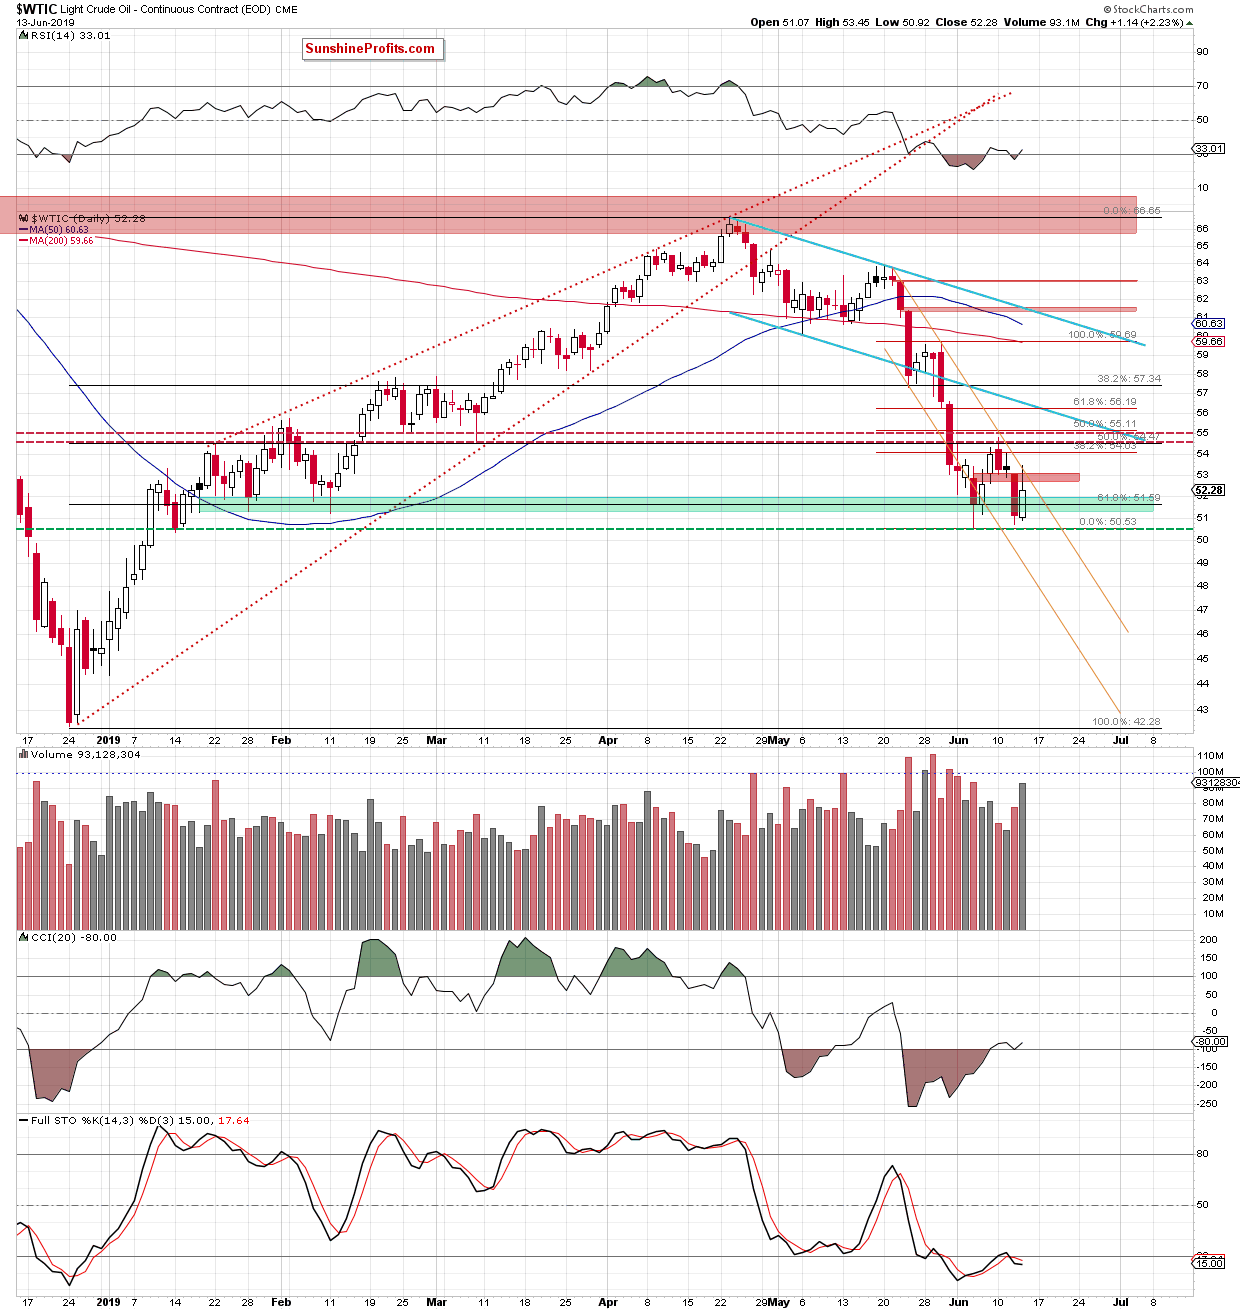
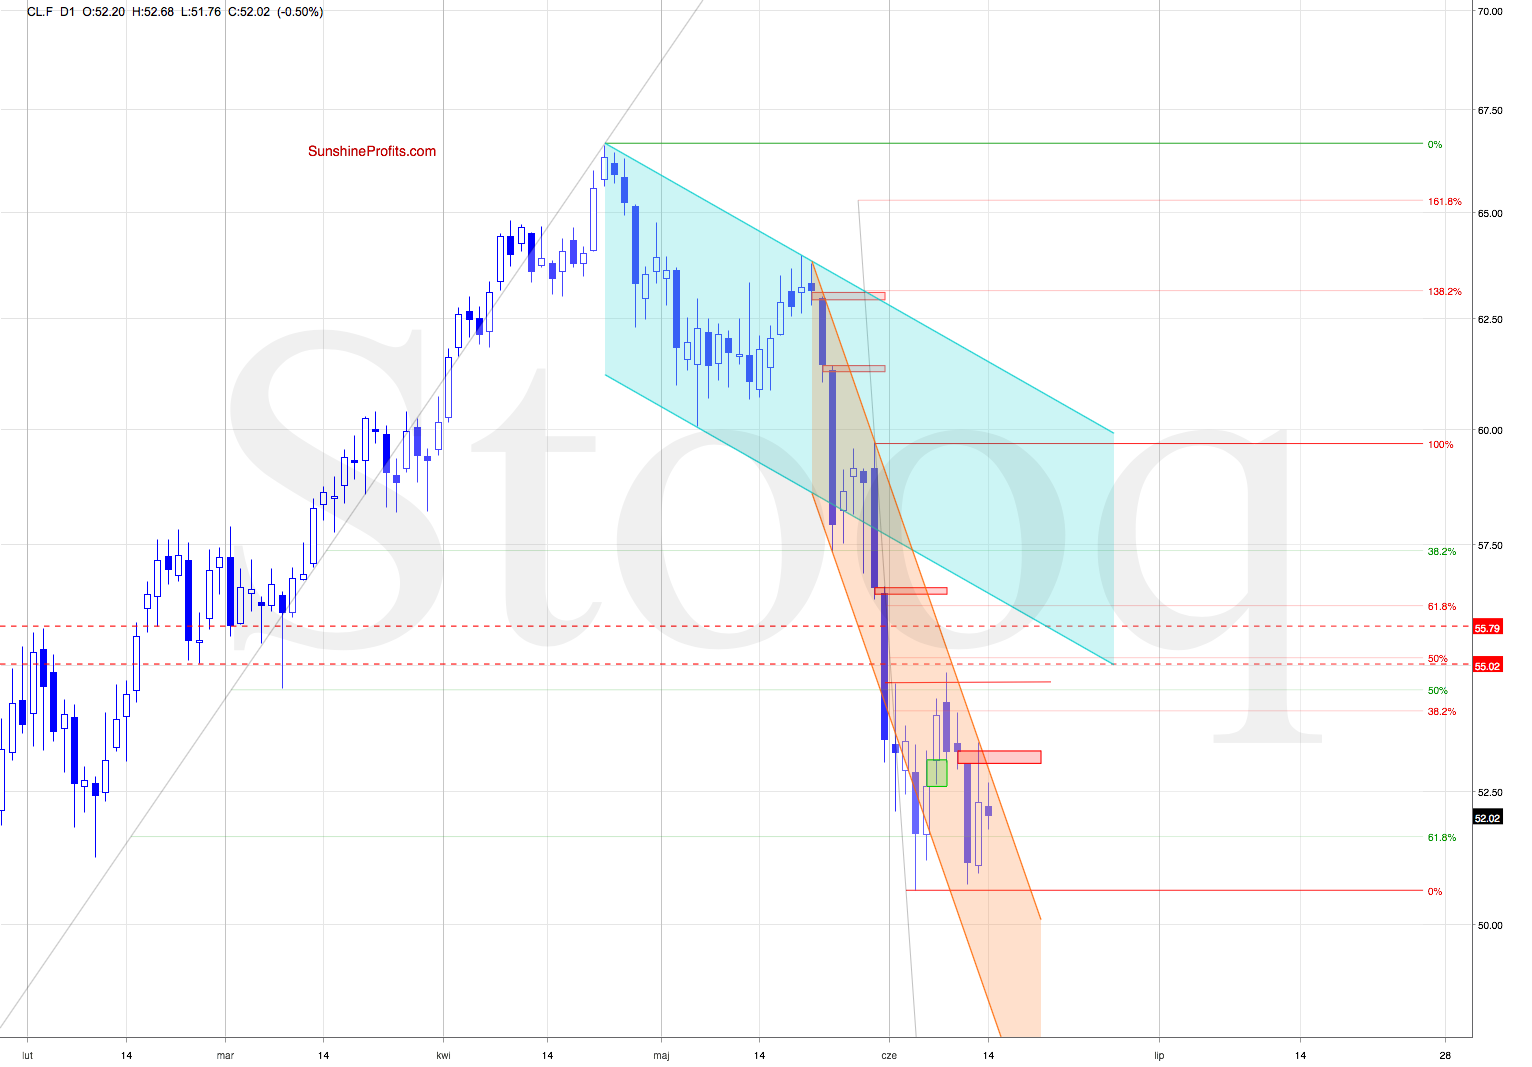
Although crude oil went on a tear Friday, the combination of the red gap and the upper border of the orange declining trend channel stopped the bulls. The upper knot is an evidence of the bulls giving up part of their gains before the day was over.
It hints at the bulls having issues overcoming the nearest resistance. It suggests their weakness. It's true that Friday's volume was higher than the day before, but this is mainly due to the increased participation of both the bulls and bears in an effort to close or defend the red gap.
How did Friday's price action affect Friday's trading appetite?
Crude oil futures opened on Friday below Friday's closing price. There was another attempt to go north but the bears again rebuffed that.
Connecting the dots, as long as the gap remains open, lower oil prices remain ahead of us. Should we see a continuation of the reversal lower, light crude will likely test the lower border of the orange declining trend channel in the following days.
Before finishing Friday's Alert, let's examine the weekly perspective in oil.
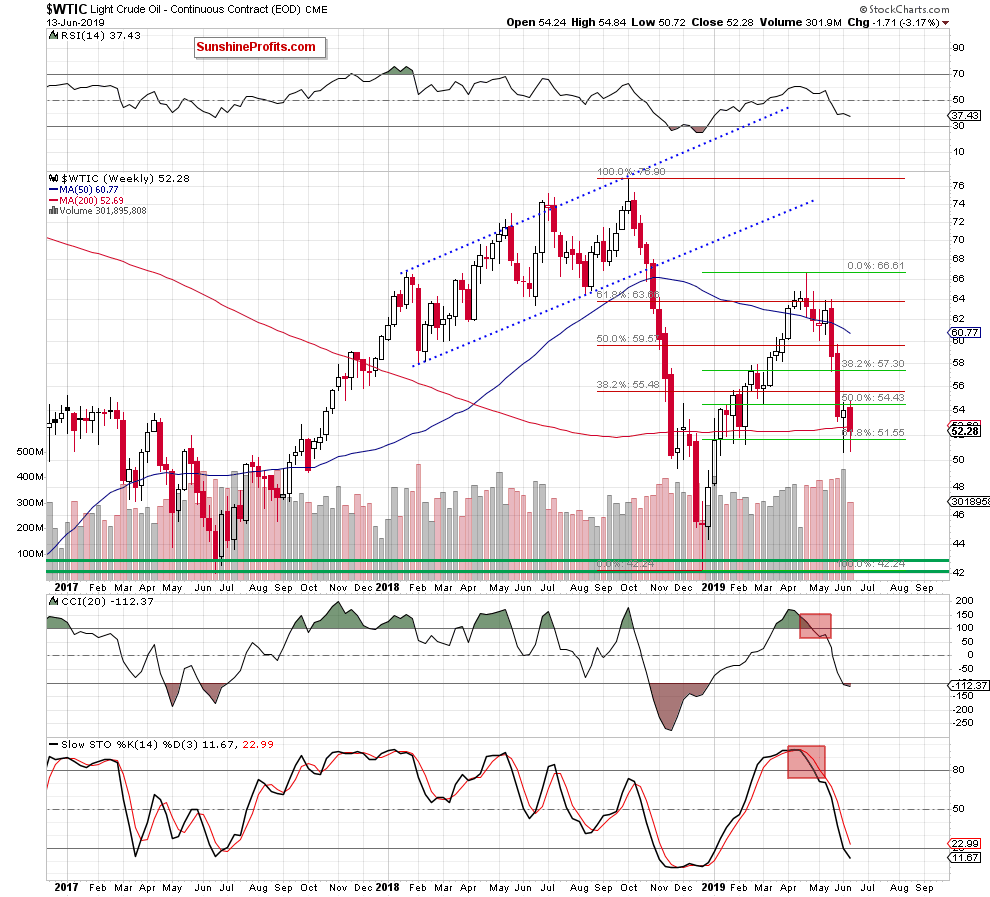
The weekly chart reveals the black gold is trading below the previously-broken 200-week moving average. Should the bears manage to close Friday's session and the whole week below $52.69 (the current level of the moving average), it would serve as one more bearish sign to complement the outlook.
Additionally, the sell signals generated by the weekly indicators remain on the cards. They also speak in favor of lower prices of light crude ahead.
Summing up, Friday's upswing failed to emerge as a reversal of Wednesday's powerful downswing and earlier Friday, the bulls do not appear to be any stronger. Oil is still trading well below the 38.2% Fibonacci retracement and inside the declining orange trend channel. At a minimum, one more downswing remains likely. This is supported by the position of the daily Stochastic Oscillator. The weekly chart analysis shows the weekly indicators to be on sell signals. Friday's closing price will show whether black gold finishes the week below the 200-week moving average, giving the bears one more reason to act. The short position remains justified from the risk/reward point of view.


