💎 Fed’s first rate cut since 2020 set to trigger market. Find undervalued gems with Fair ValueSee Undervalued Stocks

Crude Oil Extends Gains Above 102

Published 02/21/2014, 05:03 AM
Updated 07/09/2023, 06:31 AM
GC
-
CL
-

Gold has moved well above 1300 mark, and is forming an extended leg from 1251, triangle low. Notice that we have adjusted the wave count, but we see a corrective advance from 1181 now at 1330 resistance. We are observing more simple count now this time; a zigzag with a triangle placed in wave (b). We also know that wave (b) pattern CANNOT be labeled as wave two, because triangles never occur in wave two position. So, because of that situation we are even more confident that rally is a contra-trend and that gains will be limited. A decline beneath 1290 area could be an important sign for a confirmed top.

Gold 4 Hour Analysis
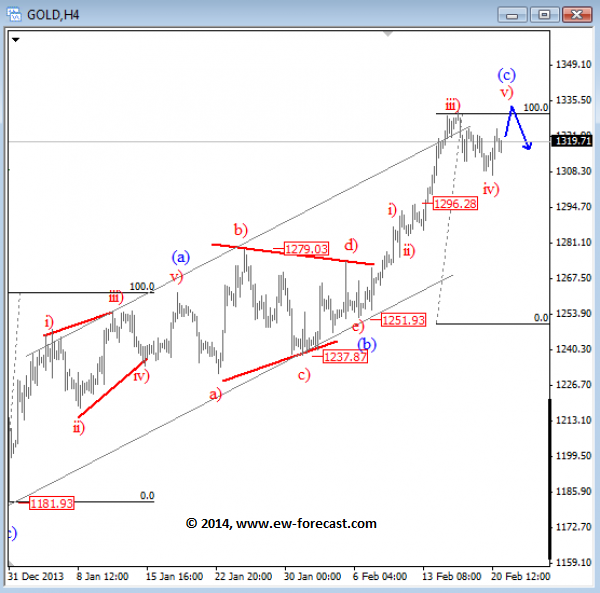
Gold Hourly Chart


Crude Oil extended gains above 102 in the past 24 hours, which makes the move from 96.75 an extended one. We still see that leg as wave (v), final leg in wave A that should send price down in wave B in the next few sessions and days. An impulsive drop back to $100 would suggests that wave B in already progress.


Oil 4 Hour Analysis
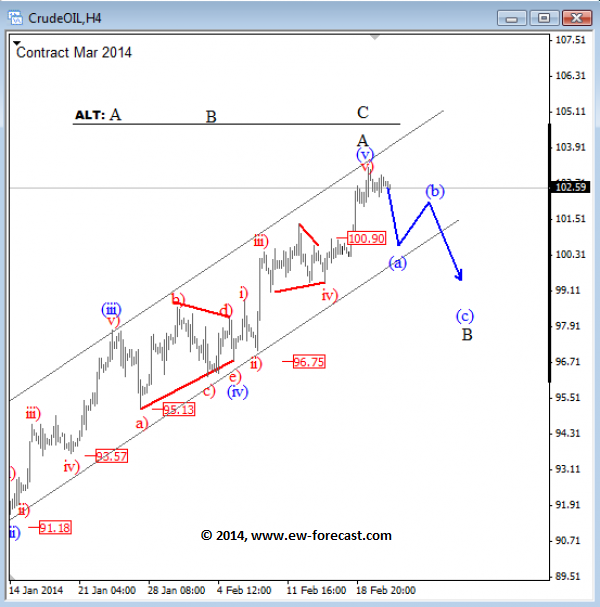
Crude Oil Hourly Chart

Latest comments

Loading next article…
Risk Disclosure: Trading in financial instruments and/or cryptocurrencies involves high risks including the risk of losing some, or all, of your investment amount, and may not be suitable for all investors. Prices of cryptocurrencies are extremely volatile and may be affected by external factors such as financial, regulatory or political events. Trading on margin increases the financial risks.
Before deciding to trade in financial instrument or cryptocurrencies you should be fully informed of the risks and costs associated with trading the financial markets, carefully consider your investment objectives, level of experience, and risk appetite, and seek professional advice where needed.
Fusion Media would like to remind you that the data contained in this website is not necessarily real-time nor accurate. The data and prices on the website are not necessarily provided by any market or exchange, but may be provided by market makers, and so prices may not be accurate and may differ from the actual price at any given market, meaning prices are indicative and not appropriate for trading purposes. Fusion Media and any provider of the data contained in this website will not accept liability for any loss or damage as a result of your trading, or your reliance on the information contained within this website.
It is prohibited to use, store, reproduce, display, modify, transmit or distribute the data contained in this website without the explicit prior written permission of Fusion Media and/or the data provider. All intellectual property rights are reserved by the providers and/or the exchange providing the data contained in this website.
Fusion Media may be compensated by the advertisers that appear on the website, based on your interaction with the advertisements or advertisers.
© 2007-2024 - Fusion Media Limited. All Rights Reserved.