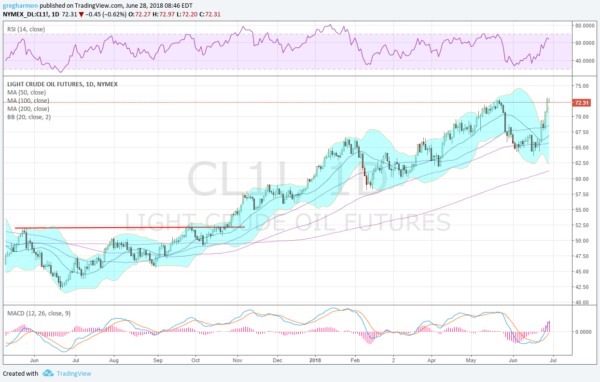
Crude Oil has had a phenomenal year. Since rising out of the base 12 months ago it is up nearly 70%. But it was also up nearly 70% back in the middle of May. That is when it dropped 10% in 2 weeks, before the recovery to the current level. Was that pullback the pause that refreshed or is this move higher just a retest before a tumble?
The chart below shows that price action over the last 12 months. In September it moved over its 100 day SMA and continued higher. it broke above the May 2017 high in October and gathered strength. The initial run took it to a high in January. The 10% pullback from there stopped short of the 100 day SMA and it reversed to the upside in February. The following wave took it to the May 2018 peak. The pullback from there reached the 100 day SMA and settled for 2 weeks.

The latest move higher started after the Bollinger Bands® had squeezed in and then rapidly expanded. But now Crude Oil has moved beyond the upper Bollinger Band. This overbought condition suggests a pause for now at the prior high. The momentum indicators are not signalling overbought though. The RSI is rising in the bullish zone while the MACD moves higher and is positive. Neither are near extreme levels. The total picture suggests the upside may continue after a pause. The next week could tell.
The information in this blog post represents my own opinions and does not contain a recommendation for any particular security or investment. I or my affiliates may hold positions or other interests in securities mentioned in the Blog, please see my Disclaimer page for my full disclaimer.
