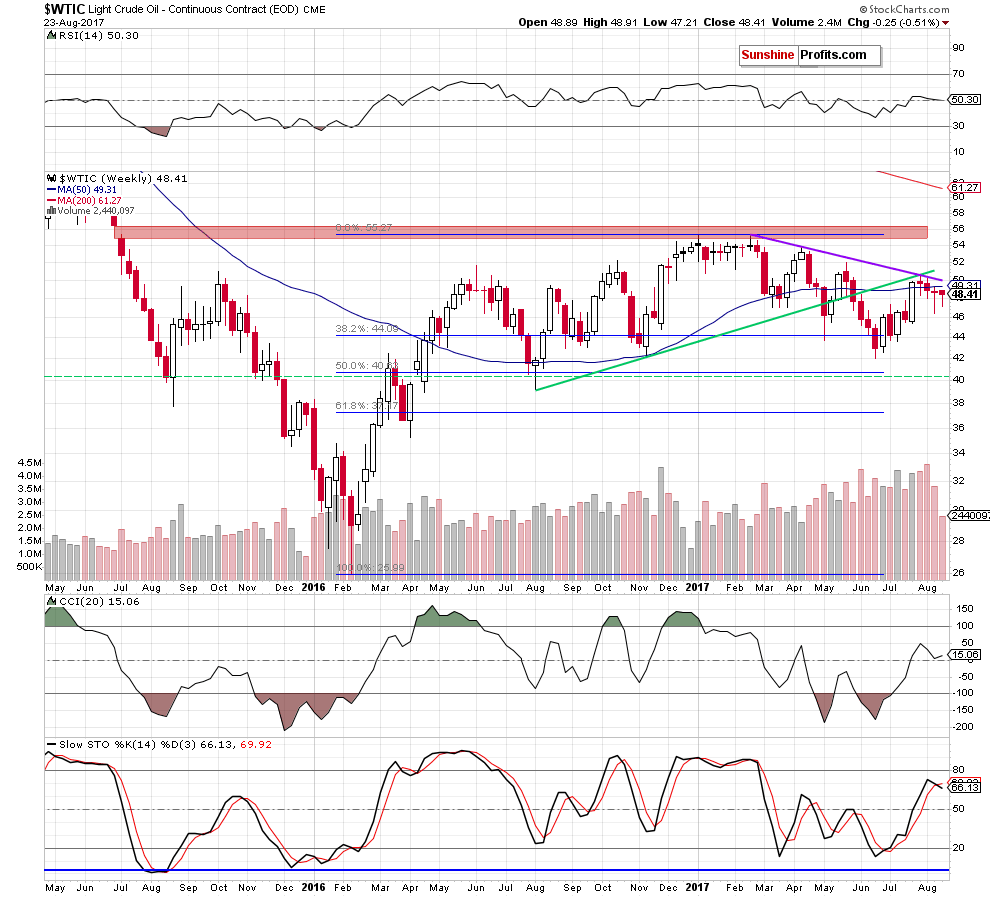
On Wednesday, light crude gained 1.21% after the EIA weekly report showed declines in crude oil and gasoline inventories. As a result, the black gold came back above the lower border of the trend channel, but can we trust this increase?
Crude Oil’s Technical Picture
Let’s take a closer look at the charts.


charts courtesy of stockcharts.com
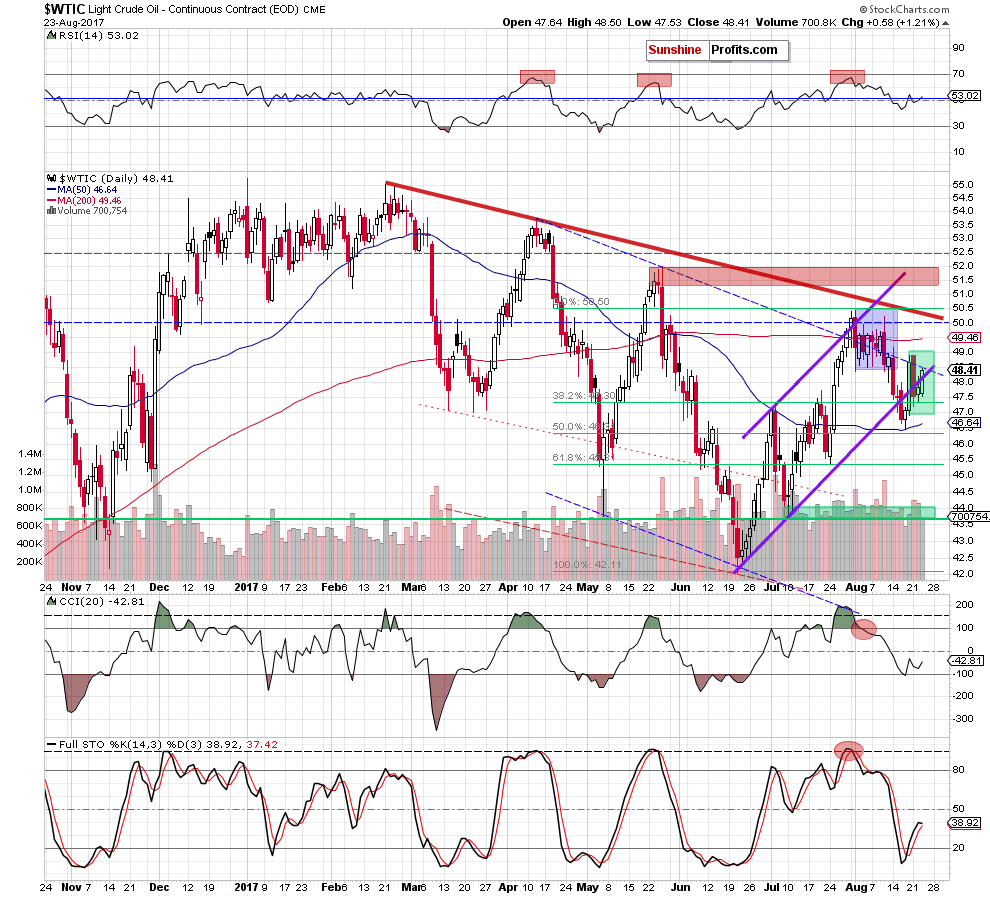
Looking at the daily chart, we see that crude oil extended Tuesday’s gains and climbed above the lower border of the purple rising trend channel, invalidating the earlier breakdown. But is this move as positive as it looks at the first sight?
In our opinion, it is not, because this is a repeat of what we already saw on Friday. Why? Although the commodity invalidated the breakdown, yesterday’s move materialized on smaller volume than earlier declines, which raises doubts about oil bulls’ strength once again. What’s interesting, the size of volume, which accompanied Wednesday’s increase, was even smaller than what we saw on Friday. This suggests that we’ll likely see another downswing and a breakdown under the lower line of the trend channel in the very near future (maybe even later in the day).
Additionally, the black gold remains in the green consolidation, which suggests that the breakdown below the lower border of the formation will result not only in a test of the recent lows, but also will open the way to lower levels.
How Low Could Oil Go?
We believe that the best answer to this question will be the quote from our yesterday’s Oil Trading Alert:
(…) In our opinion, if crude oil declines from current levels, the first downside target will be the recent low, the 50-day moving average and the 50% Fibonacci retracement (around $46.32-$46.60). However, if this support area is broken, we’ll see further deterioration and a test of the late July low of $45.40 and the 61.8% Fibonacci retracement in the following day(s).
Finishing today’s alert please keep in mind that although EIA reported declines in crude oil and gasoline inventories, the report also showed that U.S. crude oil production rose by 26,000 barrels a day to 9.528 million last week, which was the highest level since July 2015. In our opinion, this is strong negative news, which will give oil bears another important reason to act in the following days (similarly to what we saw a week ago).
Summing up
Although crude oil climbed above the lower border of the purple rising trend channel (invalidating the earlier breakdown), in our opinion, this is nothing more than the repeat of what we already saw on Friday (yesterday’s increase wasn’t confirmed by higher volume). Therefore, we believe that another move to the downside is still ahead of us and our profitable short positions continue to be justified from the risk/reward perspective. This could change in the coming days and - as always - we'll keep our subscribers informed.
Thank you.
