It is never clear whether a bottoming process is developing or the price action is just a pause before anther leg lower. A bear flag and an early stage bullish reversal both look the same. It does not help that also at these points opinions become even more entrenched. Trying to see through the noise to the facts, price action, can get difficult. One good example of this is in Crude Oil.
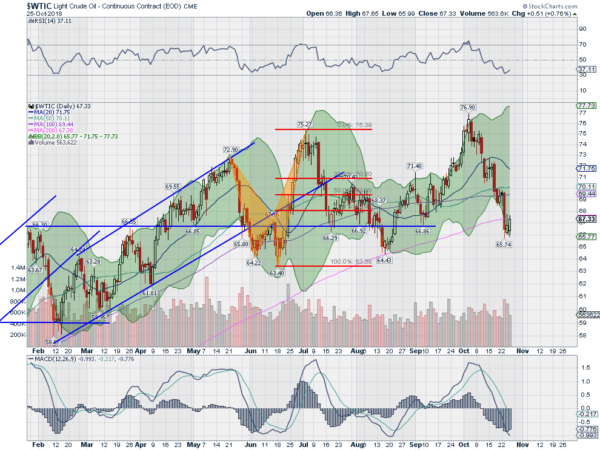
The chart below shows a solid trend lower in Crude Oil since an early October high. And you can clearly see the 3 points where it paused for a couple of days before continuing lower. It is in another of these consolidation periods as we come to the close of the week. Will this be the reversal or is it just another pause before a move lower.

The bear case is easy to make. A trend is underway, momentum has faded as shown with the RSI and MACD in bearish ranges. And the price is now under its 200 day SMA. The case for a bottom is less easy but still compelling. Start with those momentum gauges at levels where Oil has bounced in June and August. Thursday’s price action also shows strength and buying all day, not the indecision of a doji candle the past consolidations have seen.
A bottom and reversal here would confirm the longer term uptrend is intact. It would make for a higher low to go along with the series and the series of higher highs. Friday may give the final answer. Or it may not. A trader could start a long position here using 66 as a stop loss. Or initiate a short using the 200 day SMA as the stop.
The information in this blog post represents my own opinions and does not contain a recommendation for any particular security or investment. I or my affiliates may hold positions or other interests in securities mentioned in the Blog, please see my Disclaimer page for my full disclaimer.
