Crude Oil Prices: The Elliott Wave Reason For The Reversal

Published 11/08/2020, 05:39 AM
Updated 07/09/2023, 06:31 AM

At the start of last week crude oil was trading at less than $36 a barrel. It was down from $43.84 in August and from $41.91 on October 20th. Fortunately, Elliott Wave analysis helped us prepare for this selloff in advance.

So, when the weekly session began, the price of crude oil was down 14% over the past ten trading days. Experts were quick to explain the decline with the subdued demand due to the COVID-19 pandemic. This argument has been used every time crude oil dropped since March. Unfortunately, it is of no use to traders, who need a lot more than a mere after-the-fact explanation.

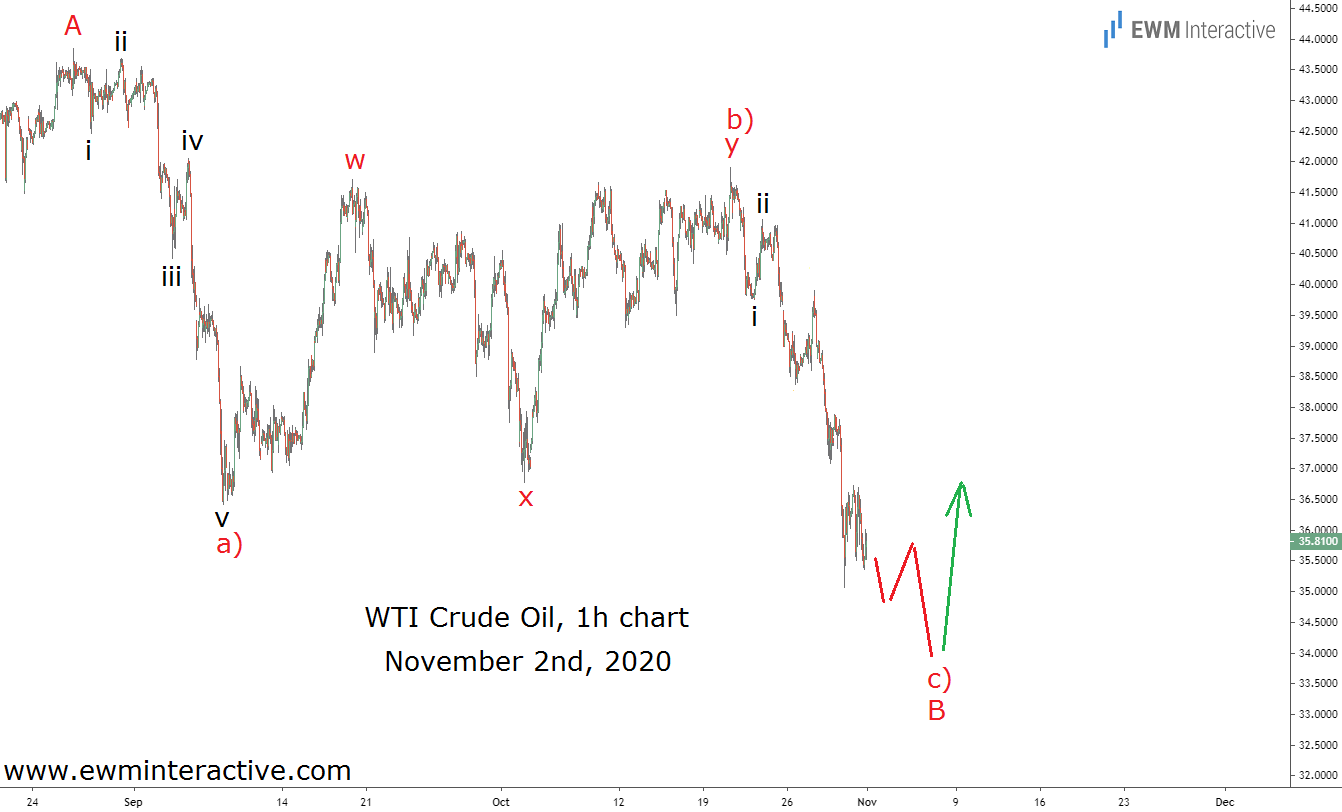
The truth is that by the time the news arrives, the trading opportunity is long gone. Instead of waiting for it, we prefer to rely on Elliott Wave analysis. No trend lasts forever and we knew crude oil’s decline won’t either, regardless of what others were saying. So, before the open on November 2nd, we sent the following chart to our subscribers to prepare them for a bullish reversal.
WTI Crude Oil 1 Hr Chart

Putting the recent weakness in the context of the big picture allowed us to see that a three-wave correction has been in progress. The structure from the top at $43.84 looked like an almost complete a)-b)-c) zigzag. According to the theory, once a correction is over, the larger trend resumes.

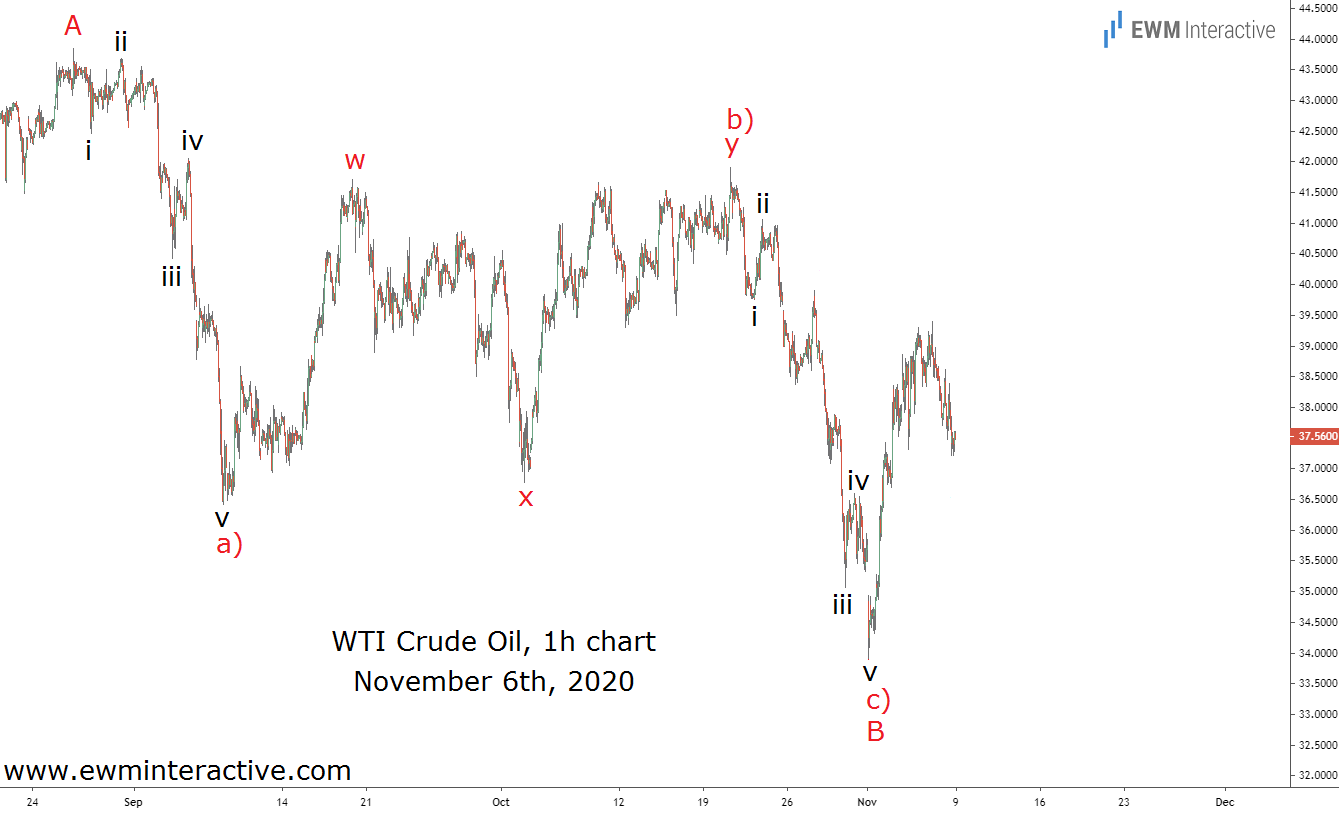
So instead of extrapolating the past into the future, we thought a bullish reversal should be expected below $34 a barrel. The price had been in an uptrend prior to this three-wave drop and it made sense to expect more upside once wave c) ended. The chart below shows what happened next.
Crude Oil 1 Hr Chart

The price of crude oil initially fell to $33.78. On November 5th, it touched $39.53, up 17% in a matter of days. Europe is going into a second lockdown and the coronavirus situation in the US and the rest of the world is hardly improving. From that point of view, WTI‘s surge makes no sense at all. It makes a lot of Elliott Wave sense, however, if one knows what patterns to look for.

Original Post

Latest comments

Loading next article…
Risk Disclosure: Trading in financial instruments and/or cryptocurrencies involves high risks including the risk of losing some, or all, of your investment amount, and may not be suitable for all investors. Prices of cryptocurrencies are extremely volatile and may be affected by external factors such as financial, regulatory or political events. Trading on margin increases the financial risks.
Before deciding to trade in financial instrument or cryptocurrencies you should be fully informed of the risks and costs associated with trading the financial markets, carefully consider your investment objectives, level of experience, and risk appetite, and seek professional advice where needed.
Fusion Media would like to remind you that the data contained in this website is not necessarily real-time nor accurate. The data and prices on the website are not necessarily provided by any market or exchange, but may be provided by market makers, and so prices may not be accurate and may differ from the actual price at any given market, meaning prices are indicative and not appropriate for trading purposes. Fusion Media and any provider of the data contained in this website will not accept liability for any loss or damage as a result of your trading, or your reliance on the information contained within this website.
It is prohibited to use, store, reproduce, display, modify, transmit or distribute the data contained in this website without the explicit prior written permission of Fusion Media and/or the data provider. All intellectual property rights are reserved by the providers and/or the exchange providing the data contained in this website.
Fusion Media may be compensated by the advertisers that appear on the website, based on your interaction with the advertisements or advertisers.
© 2007-2025 - Fusion Media Limited. All Rights Reserved.