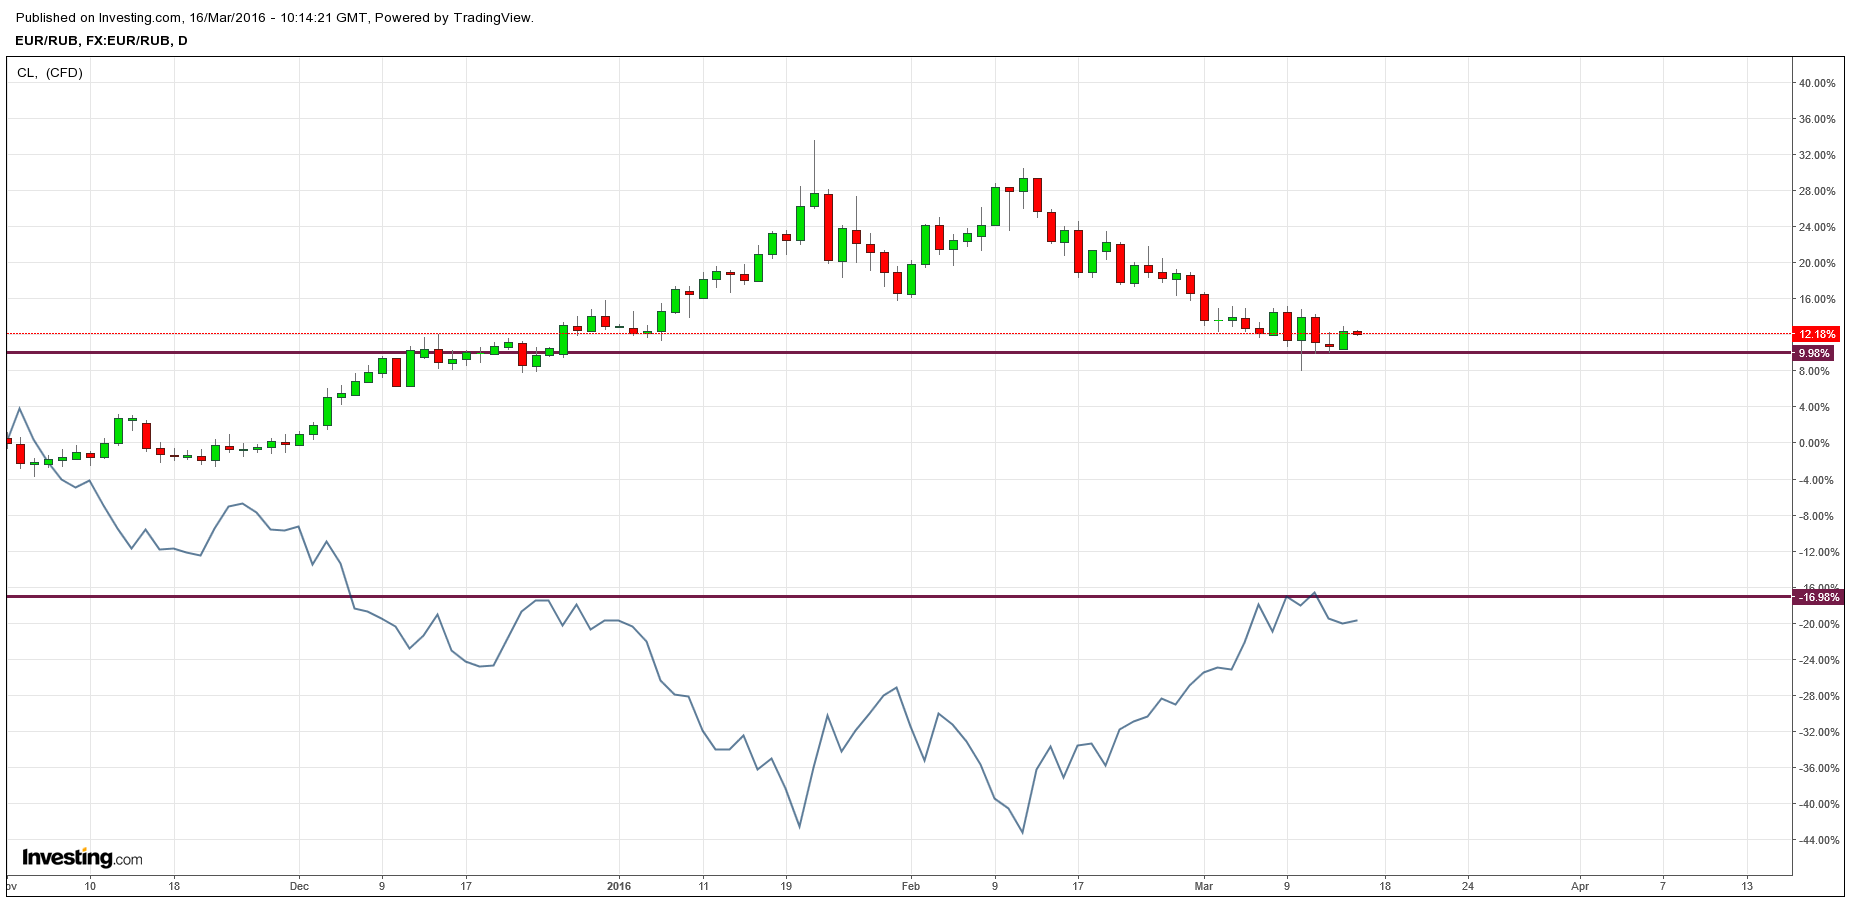
For experienced traders, the correlation between crude oil and the ruble is well known, due to the fact that the Russian economy is dependent on crude oil. Crude accounts for 16% of Russia's GDP and 70% of its exports.
The daily charts for both CL and the EUR/RUB currency pair have formed quite an interesting pattern, with the first reversing after a double bottom and the latter after a double top.
We are now probably at a crucial stage. If oil continues to rise above 40 USD per barrel then we might also see the EUR/RUB breaking below 76.000.

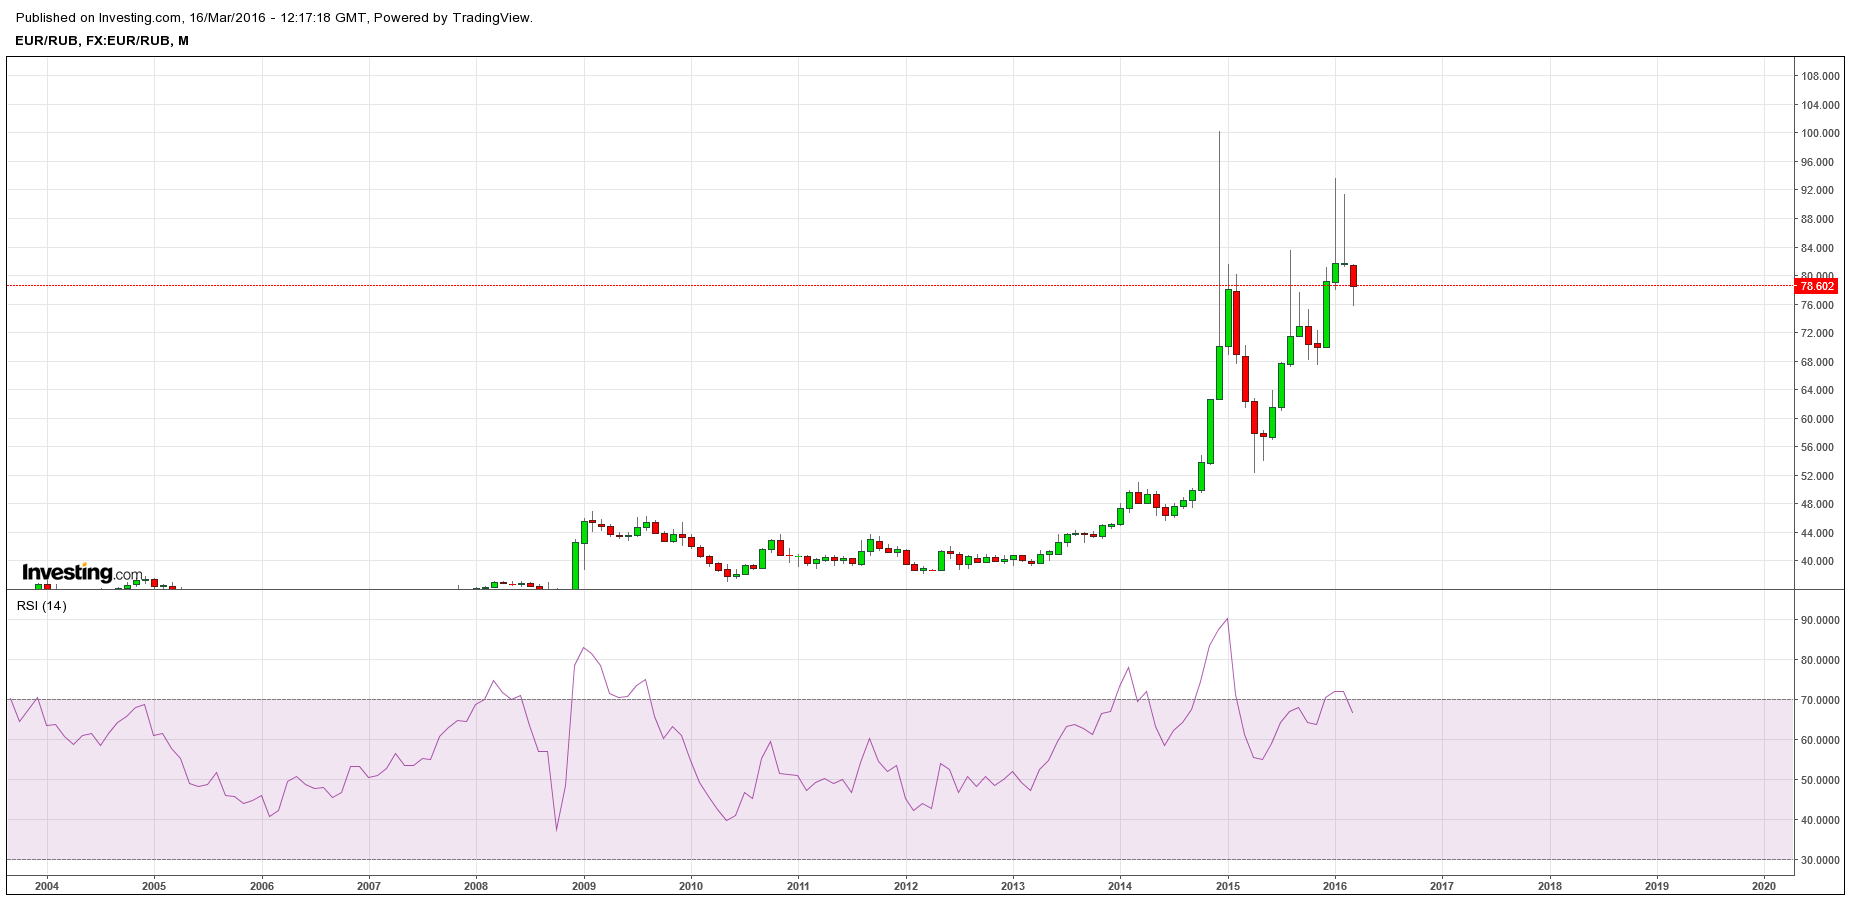
As you can see on the chart above the patterns are clear, and signify the correlation of the RUB and crude oil. Furthermore the Relative Strength Index (RSI) on EUR/RUB shows selling pressure, but the pair is not even near yet entering an oversold condition. On the monthly chart the pair is exiting an overbought condition (see graph below), and as you can see we have a doji candlestick indicating a reversal. If this month the selling pressure continues forming a bearish candlestick for March, that will follow the doji, forming probably another reversal pattern on the monthly.

Although many people in Russia have been worried that the pair will hit 100, since December 2014 the pair failed to stabilize its price above 80.0, marking this level as a strong resistance. The last four months (from Dec 2015 to Mar 2016) were the the only time since Dec 2014 that the pair increased its presence (in terms of time period) above 80, which underscores the importance of a breakdown below 76.0 or not. A possible reversal and a break above 80.66 resistance might keep the pair above 80 for a long time.
Disclaimer: Any research, analysis, prices, strategies, learning material or other information contained on this article & website does not constitute investment advice. The articles should not be construed as a recommendation or an offer to buy or sell any security or currency.
