Hourly Chart
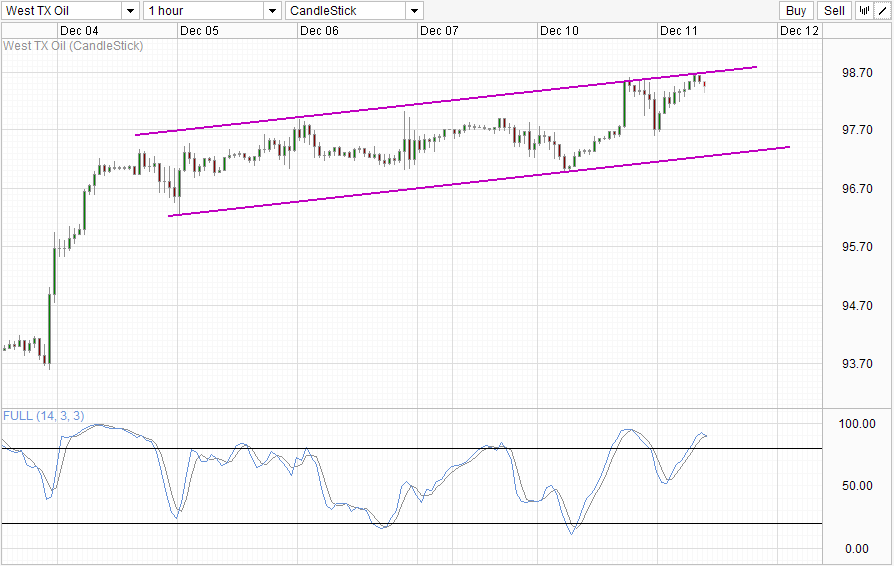
Crude Oil rose to a 6-week high yesterday with Futures prices hitting a high of $98.60 per barrel. However, the peak was made during early European session (pre US open hours) and prices actually traded lower when the US market opened. Prices did recover a significant chunk of losses post New York noon, but even with bullish inventory numbers coming out from American Petroleum Institute during late US session, prices still did not manage to climb back above $98.6 by the time the US stopped trading.
To be sure, API inventory numbers are actually rather bullish, reporting that crude inventories have fallen by 7.5 million barrels last week versus an expected 3 million barrels - showing a higher than expected implied demand for crude. But prices merely jumped slightly more than 20 cents when the news were released at 4.30pm EST (5.30 SGT), suggesting that the market isn't really as bullish as we think it is.
Hence, it is no surprise to see prices currently heading lower right now during today's Asian session, rebounding lower as bulls failed to break the Channel Top. This opens up the Channel Bottom as a viable bearish target with 97.7 likely to provide interim support. The Stochastic indicator agrees with the Stoch curve currently heading lower. A proper bearish cycle signal has not yet formed, but a bearish signal will most likely be available when price breaches below the soft support zone between 98.1 - 98.2.
Daily Chart
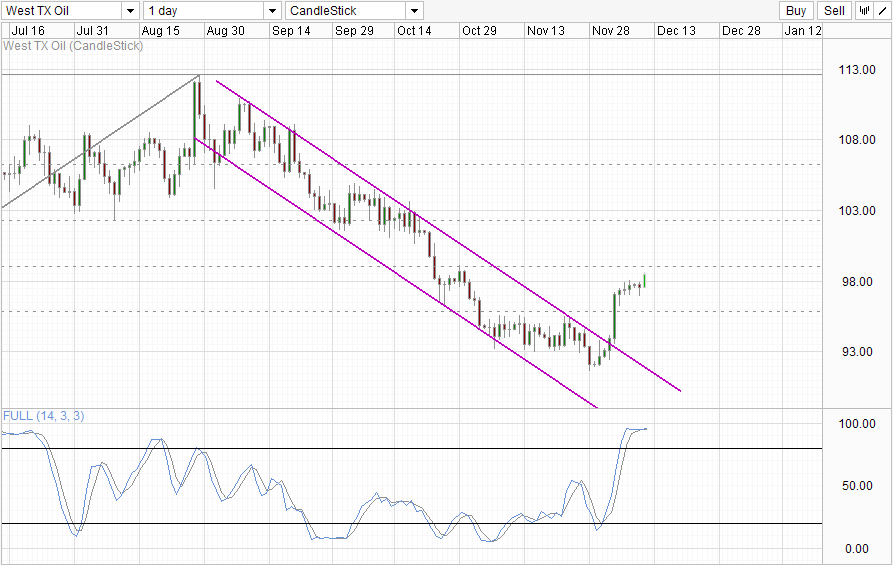
The Daily Chart also favors bearish objectives moving forward as bulls will be facing strong resistance in the form of 61.8% Fib retracement which is in confluence with the swing high back on 29th October. Stochastic readings also suggest that current bullish momentum is Overbought, favoring a pullback moving forward and reducing the likelihood of prices breaking the 61.8% level. Nonetheless, if 61.8% is broken, 50% will open up as a viable bullish target but the ability to break that level will be even lower as it is close to the 103.0 round figure support turned resistance - not to mention that Stochastic readings will be extremely Overbought should that happen.
Fundamentally, global demand for crude is still decreasing as the global economic recovery is not as strong as we thought it would be in early 2013. Demand has fallen so much that OPEC reduced crude production in November to the lowest level in more than 2 years in order to keep prices afloat. On the other hand, the US is still pumping at record levels and production is expected to rise all the way to 2015. Hence, it is difficult to see WTI prices rising in the long-term, and the decline in inventory in the past 2 weeks may simply be outliers and not representative of the demand/supply dynamics.
Furthermore, it should be noted that the official numbers from the US Energy Information Administration last week were lower than the API counterpart, and the same may happen this week too. Right now expectations have been upgraded from the original -3 million to API's version of -7.5 million, hence if EIA's numbers reflect a lower decline, we could see bears coming in early and driving prices lower even without tagging the 61.8% Fib.
Original post