Talking Points
- Commodities May Reverse Recent Moves as Markets Correct
- Gold Prices Testing Critical Resistance at $1,270 Level
- Quiet Calendar Leaves Focus on Upcoming FOMC Meeting
Crude Oil suffered on Friday as broad-based risk aversion may have prompted some profit-taking in the growth-sensitive commodity. Meanwhile, gold benefited from unravelling investor sentiment as a decline in US 10 year yields weakened the appeal of the US Dollar, driving demand for the fiat-money alternative.
While US New Home Sales figures are set to cross the wires in the hours ahead, traders may be less inclined to commit to a directional bias in light of the upcoming, highly influential FOMC meeting. Given Friday’s dramatic moves, it may be reasonable then to expect a corrective period that erases some of the ground covered in the final hours of last week’s trade.
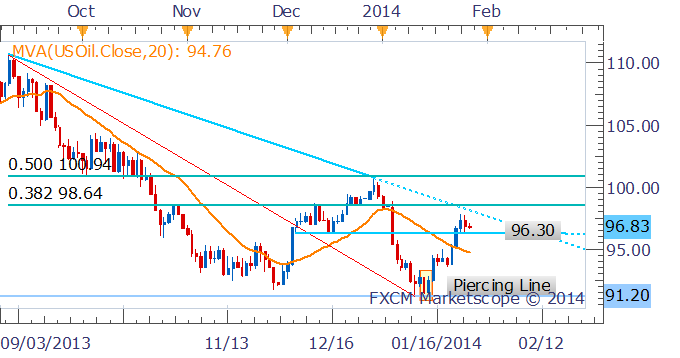
CRUDE OIL TECHNICAL ANALYSIS – The recent rally in crude has encountered some resistance just shy of the descending trending line from the September 2013 high. However, with support nearby at the 96.30 level it may be too early to call for a reversal in the absence an additional bearish signal.

Daily Chart - Created Using FXCM Marketscope 2.0
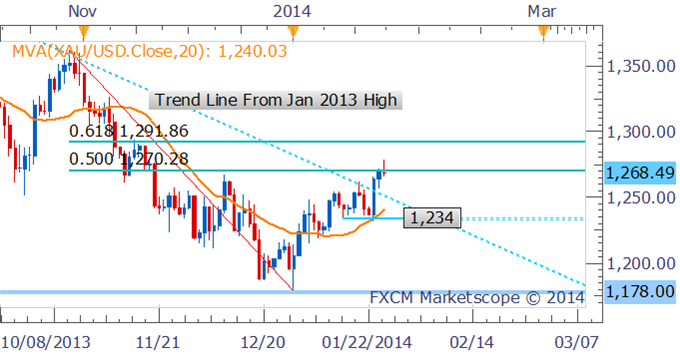
GOLD TECHNICAL ANALYSIS – A break above the descending trend line from the January 2013 high, along with a short-term uptrend (signaled by the 20 SMA), are both providing bullish signals for gold. However the precious metal has encountered some selling pressure at $1,270, which represents the 50% Fib retracement level from the October to December 2013 decline. While there is an absence of a strong reversal signal, it may be preferable to wait for clearance of $1,270 before looking at entering new long positions.

Daily Chart - Created Using FXCM Marketscope 2.0
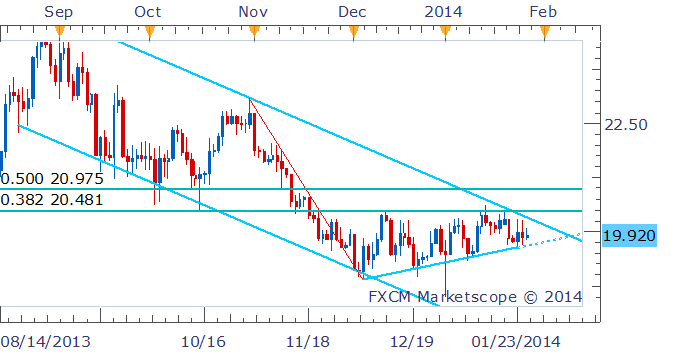
SILVER TECHNICAL ANALYSIS – The recent consolidation in the silver price has resulted in an ascending triangle formation. The fact that sellers have been unable to push the commodity down to its previous lows may be signaling an imminent upside breakout. A move above the 38.2% Fib retracement level ($20.48) would open up $21.

Daily Chart - Created Using FXCM Marketscope 2.0
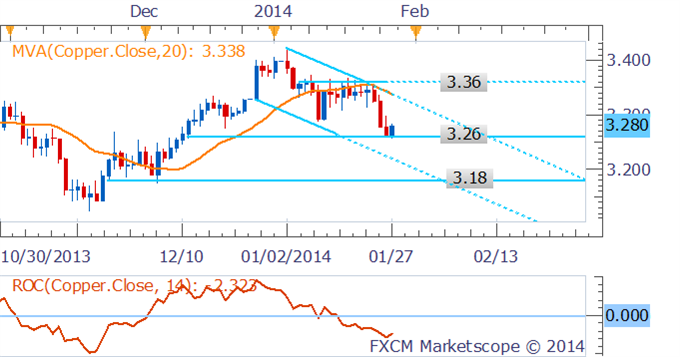
COPPER TECHNICAL ANALYSIS– Building downside momentum in the recent downtrend is warning of further declines for copper. A break below buying support at $3.26 may pave the way for a fall towards the December 2013 low around $3.18.

Daily Chart - Created Using FXCM Marketscope 2.0
--- Written by David de Ferranti, Market Analyst, FXCM Australia
