Street Calls of the Week
Talking Points
- Crude Oil Rebounds Ahead of US Inventories Data
- Precious Metals Exposed To Fading Safe-Haven Demand
- Silver At A Critical Juncture Near The $19.00 Handle
Crude oil rebounded in US trading on Wednesday (WTI +2.86 percent, Brent + 2.42 percent). A corrective bounce offers the most likely rationale behind the move, given the pair’s substantial declines earlier in the week. Positive investor sentiment on the back of ebbing Ukrainian concerns also may have contributed to the gains for the risk-sensitive commodities.
Interestingly, the cease-fire discussions in Eastern Europe reduce the likelihood of sanctions on Russian commodity exports. Which in turn may actually have negative implications for crude, as concerns over supply disruptions from the energy producer fade.
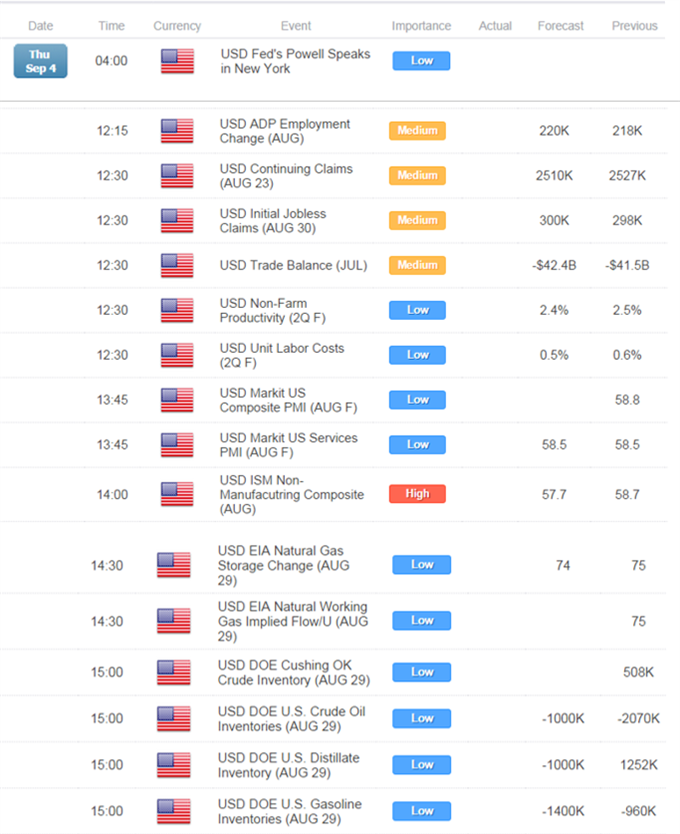
Upcoming US inventories data may generate further volatility for WTI. Total crude stocks are tipped to decline for the third consecutive week. Yet concerns over a lingering supply glut in the US remain. This follows the last DOE report which revealed a ramp up in US crude production to its highest rate since 1986. Until we see a more broadly constructive picture painted by incoming reports selling pressure for WTI may remain.
Also in the energy space; the weekly natural gas storage report is set to cross the wires during the session ahead. Another above-average storage injection figure would likely keep natural gas prices contained below the $4.00 handle.
Finally, the precious metals remain vulnerable as traders look past turmoil in Iraq and Ukraine. Fading concerns surrounding the regional conflicts threaten to sap safe-haven demand for the alternative assets. Meanwhile, on the US Dollar side of the equation ADP payrolls data and ISM Non-Manufacturing figures may offer the greenback some guidance. However, the potential for a strong response from the reserve currency to the releases is questionable. This is given that traders are likely to be treading cautiously ahead of the critical Non-Farm Payrolls report on Friday.
CRUDE OIL TECHNICAL ANALYSIS
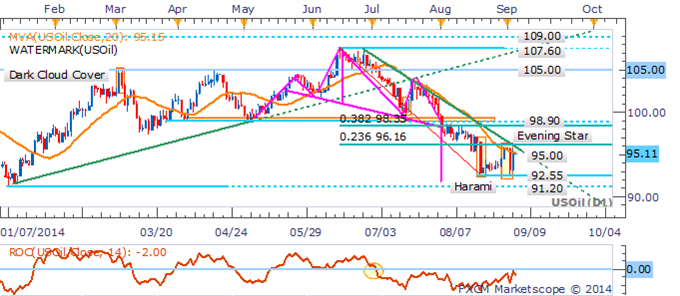
WTI’s rebound has negated the Evening Star candlestick pattern on the daily. However, the broader picture continues to warn of weakness for the commodity. This includes the presence of a sustained downtrend denoted by the descending trendline on the daily and prices holding below the 20 SMA. This leaves selling into corrective bounces preferred. A leap above the 23.6% Fib at 96.16 would be required to hint at a small base and the potential for a recovery.
Crude Oil: Selling Into Rallies Preferred As
GOLD TECHNICAL ANALYSIS
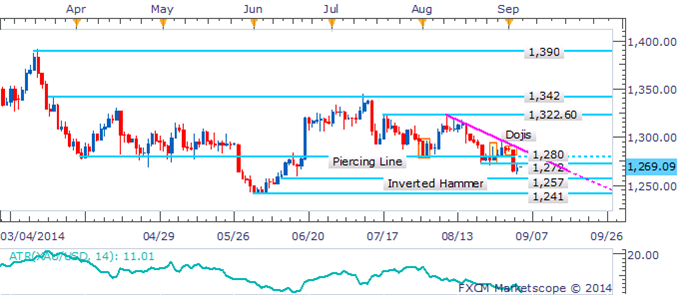
Gold’s crawl under the 1,272 floor turns the immediate risk lower for the precious metal and casts the spotlight on the 1,257 barrier. A break lower could see an extended decline towards the June lows near 1,241. However, it should be noted that a low ATR reading generally does not favor a sustained move following a breakout. This could make a clean run lower difficult.
The DailyFX Speculative Sentiment Index suggests a bearish bias for gold based on trader positioning.
Gold: Clearance Of The 1,280 Hurdle Casts The Immediate Risk Lower
SILVER TECHNICAL ANALYSIS
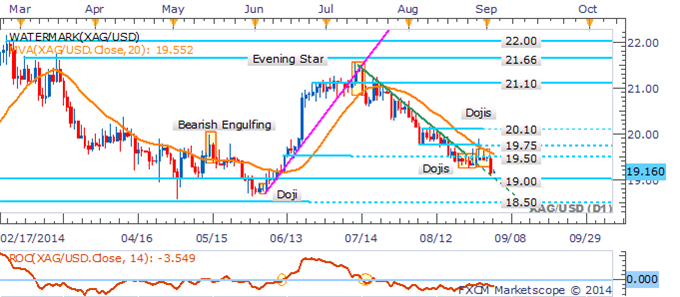
Silver is at a critical juncture near the psychologically-significant $19.00 handle. Against the backdrop of a downtrend on the daily shorts remain preferred. However, given the proximity of current prices to the nearby floor, awaiting a break before adopting new positions may be a more prudent course of action.
Silver: Awaiting Leap Over Nearby 19.00 Hurdle
COPPER TECHNICAL ANALYSIS
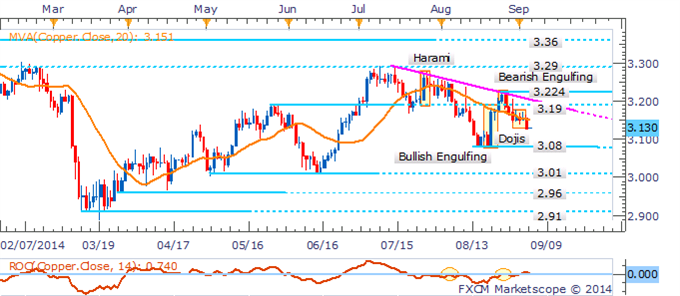
Copper’s descent has resumed after an ensemble of Dojis indicated indecision from traders. The commodity has demonstrated a tendency to whipsaw in intraday trade recently. This suggests that despite some tentative signs of a downtrend it may be difficult for a clean run lower to occur.
Copper: Dojis Signal Hesitation From Traders
PALLADIUM TECHNICAL ANALYSIS
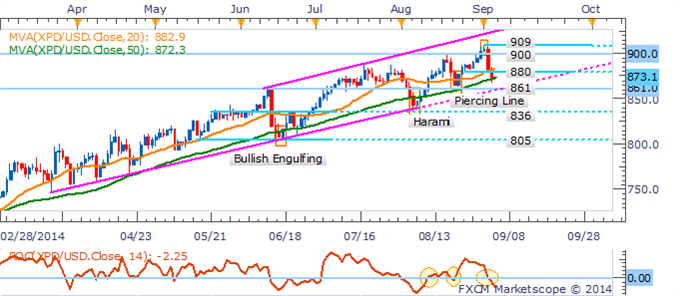
Palladium’s retreat under the 900 handle is seen as corrective at this stage. Within the context of a core uptrend buying dips is preferred. The emergence of bullish reversal signal would be likely be a safer alternative to trying to pick the bottom. A break below the ascending trend channel would be required to warn of a top and indicate the potential for further weakness.
Palladium: Buying Dips Preferred While Core Uptrend Intact
PLATINUM TECHNICAL ANALYSIS
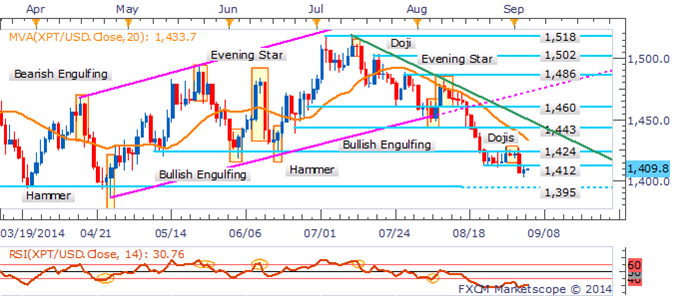
Downside risks remain for platinum given the context of a sustained downtrend on the daily. The push past the 1,412 barrier suggests the potential for a descent on the April lows near 1,395. A climb above the descending trendline would be required to warn of a base and the possibility of a sustained recovery.
Platinum: Sellers Reemerge After Failure To Crack The 1,424 Ceiling
