Talking Points
- WTI Plunges Back Below $97 on Disappointing ISM Manufacturing Data
- Silver and Copper Technicals Suggesting Short-Term Corrective Bounce
- Dovish Tone From Fed Speakers May Support Crude Oil and Copper
Crude oil has extended its recent declines following a disappointing set of US ISM manufacturing data,which helped trigger another bout of broad-based risk aversion. The print of 51.3 was the lowest in six months and well below economists’ expectations for a reading of 56. Newswires suggested the figures may have added to investors’ concerns about the pace of the US economic recovery, which was spurred by some weak economic data for December.
Investor sentiment remains highly vulnerable to negative news-flow due to fears over emerging markets and the potential effects of Fed ‘tapering’. Dovish rhetoric from Fed officials, Lacker and Evans, who are set to speak over the next 24 hours may help ameliorate risk appetite, which in turn could help support growth-sensitive commodities like copper and oil.
The ramifications of such a scenario for precious metals is somewhat clouded. On one hand, a dovish Fed may fuel recovering anti-fiat demand, boosting gold and silver. On the other, if a delay in stimulus reduction boosts risk sentiment, that may drive US Treasury yields higher, thereby increasing the opportunity cost for owning metals and sending prices lower.
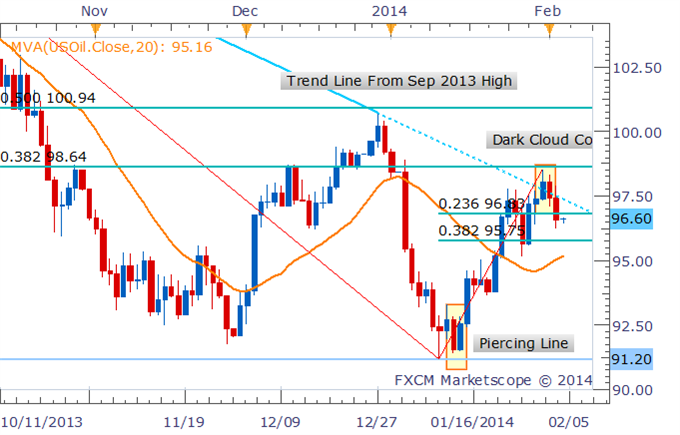
CRUDE OIL TECHNICAL ANALYSIS – Despite the recent declines, oil is still putting up a series of higher highs and higher lows, indicating a continuation of the recent uptrend. However, a failure to hold above the trend line from the Sep 13 high and a Dark Cloud cover candle pattern may be warning of a potential reversal. This leaves a mixed technical bias for the commodity.

Daily Chart - Created Using FXCM Marketscope 2.0
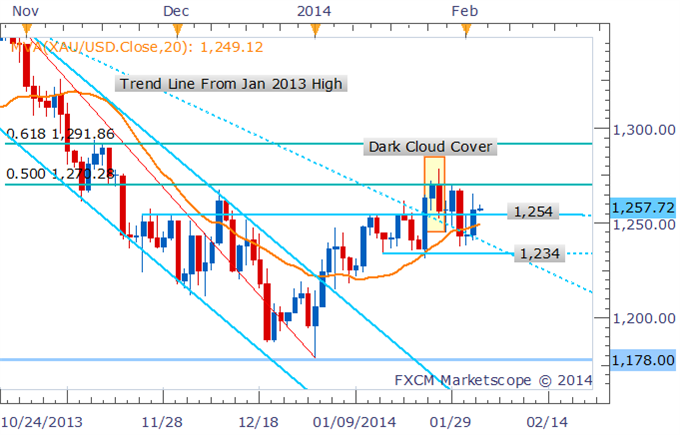
GOLD TECHNICAL ANALYSIS – While the Dark Cloud cover formation continues to warn of a more meaningful downside move for gold, buyers sitting at trend line support seemingly remain prepared to support the precious metal. A daily close below $1,234 is needed before offering a bearish bias.

Daily Chart - Created Using FXCM Marketscope 2.0
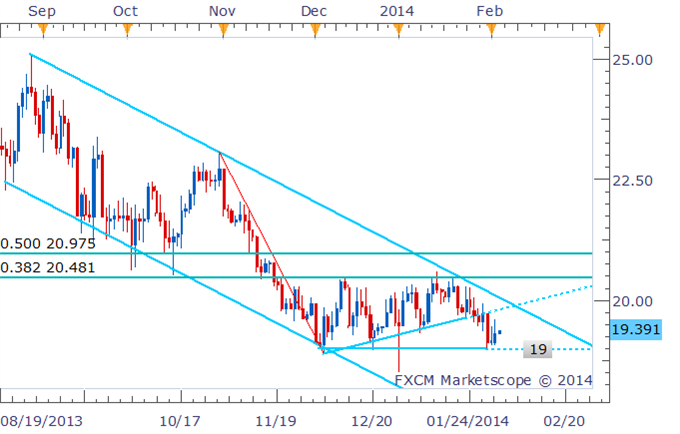
SILVER TECHNICAL ANALYSIS – As noted, $19 continues to remain an important level for silver as the commodity recovers some ground lost over the past week. Shorts are preferred on a retracement back to trend line resistance or on a break below support.

Daily Chart - Created Using FXCM Marketscope 2.0
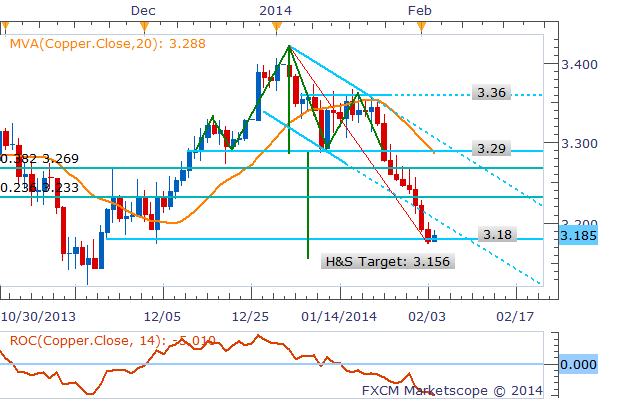
COPPER TECHNICAL ANALYSIS– Copper remains in a short-term downtrend signaled by prices remaining below the 20 SMA and persistent negative momentum. However, after 9 straight days of declines the fall looks over-extended suggesting the commodity may be due for a corrective bounce. As such, shorts are preferred on a break below close-by support at $3.180 or a retracement back to $3.233 (the 23.6% Fib Level).

Daily Chart - Created Using FXCM Marketscope 2.0
--- Written by David de Ferranti, Market Analyst, FXCM Australia
