
Crude oil (CL_F) has been rising over the last few weeks and I thought it’s time to check back in with the black-gold commodity. In April I wrote about how light crude oil was testing Fibonacci support at $86 while sentiment data continued calling for potential weakness. It seems the bulls were able to hold support and crude has rallied 12% back above $96/barrel.
The Line
The energy commodity now sits just under the falling trend line that’s batted down previous rally attempts going back to 2012. This trend line -- as well as the previous closing high at $99 -- are where buyers are likely to set their scopes. As often said, the more times a level of resistance (or support) is tested the more likely it is to break. We can’t know how many times it must be tested, but if crude can catch a few more bids we might get our third chance at higher oil prices. I’m not writing to be bullish or bearish on oil, but I will be watching these two levels of resistance and see how price reacts. As always, let price action dictate our bias.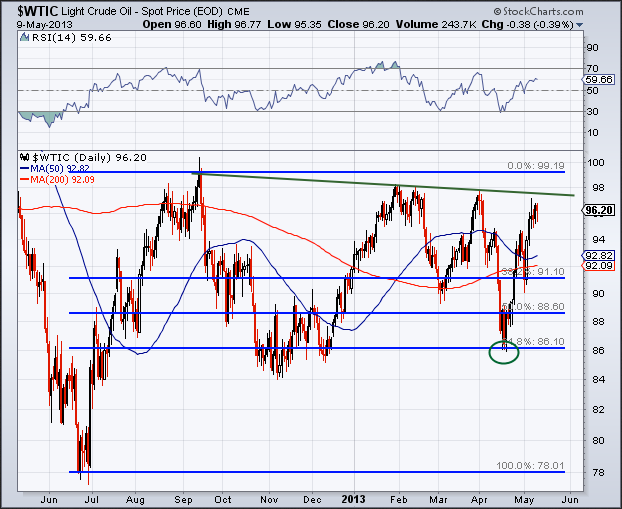
Disclaimer: Do not construe anything written in this post or this blog in its entirety as a recommendation, research, or an offer to buy or sell any securities. Everything in this post is meant for educational and entertainment purposes only. I or my affiliates may hold positions in securities mentioned in the blog. Please see my Disclosure page for full disclaimer. Connect with Andrew on Google+, Twitter, and StockTwits.
- English (UK)
- English (India)
- English (Canada)
- English (Australia)
- English (South Africa)
- English (Philippines)
- English (Nigeria)
- Deutsch
- Español (España)
- Español (México)
- Français
- Italiano
- Nederlands
- Português (Portugal)
- Polski
- Português (Brasil)
- Русский
- Türkçe
- العربية
- Ελληνικά
- Svenska
- Suomi
- עברית
- 日本語
- 한국어
- 简体中文
- 繁體中文
- Bahasa Indonesia
- Bahasa Melayu
- ไทย
- Tiếng Việt
- हिंदी
Crude's Trend Line: Third Time's A Charm?
Published 05/10/2013, 11:40 AM
Updated 07/09/2023, 06:31 AM
Crude's Trend Line: Third Time's A Charm?
Latest comments
Loading next article…
Install Our App
Risk Disclosure: Trading in financial instruments and/or cryptocurrencies involves high risks including the risk of losing some, or all, of your investment amount, and may not be suitable for all investors. Prices of cryptocurrencies are extremely volatile and may be affected by external factors such as financial, regulatory or political events. Trading on margin increases the financial risks.
Before deciding to trade in financial instrument or cryptocurrencies you should be fully informed of the risks and costs associated with trading the financial markets, carefully consider your investment objectives, level of experience, and risk appetite, and seek professional advice where needed.
Fusion Media would like to remind you that the data contained in this website is not necessarily real-time nor accurate. The data and prices on the website are not necessarily provided by any market or exchange, but may be provided by market makers, and so prices may not be accurate and may differ from the actual price at any given market, meaning prices are indicative and not appropriate for trading purposes. Fusion Media and any provider of the data contained in this website will not accept liability for any loss or damage as a result of your trading, or your reliance on the information contained within this website.
It is prohibited to use, store, reproduce, display, modify, transmit or distribute the data contained in this website without the explicit prior written permission of Fusion Media and/or the data provider. All intellectual property rights are reserved by the providers and/or the exchange providing the data contained in this website.
Fusion Media may be compensated by the advertisers that appear on the website, based on your interaction with the advertisements or advertisers.
© 2007-2025 - Fusion Media Limited. All Rights Reserved.