Crocs, Inc. (Crocs) and its consolidated subsidiaries are a designer, manufacturer, distributor, worldwide marketer and brand manager of footwear and accessories for men, women and children. The Company’s products include footwear and accessories that utilize closed cell-resin, called Croslite.
This is a note both on order flow and on vol in the context of a rather volatile stock. Let’s start with today’s action and move backward in time to examine a bit of the bumpy past. I’ve included the tick chart below. The top portion is the stock price, the bottom is the Jan vol.
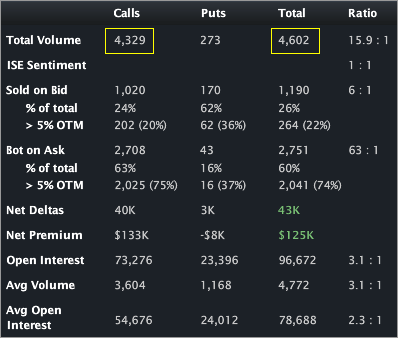
We can see the stock has bounced in early trading while the Jan vol has moved up with the underlying. This stock move has been accompanied by bullish order flow in the options. A small snippet from the Stats Tab from Livevol® Pro is included below.
We can see that of the 4,602 contracts that have traded today, all but 273 have been calls, yielding a 16:1 ratio to puts.
The only news that I could find today comes from my friends at Briefing, and it’s rather short:
“Crocs pops to HoD; Hearing move attributed to PE chatter”
Source: Provided by Briefing.com (www.briefing.com)
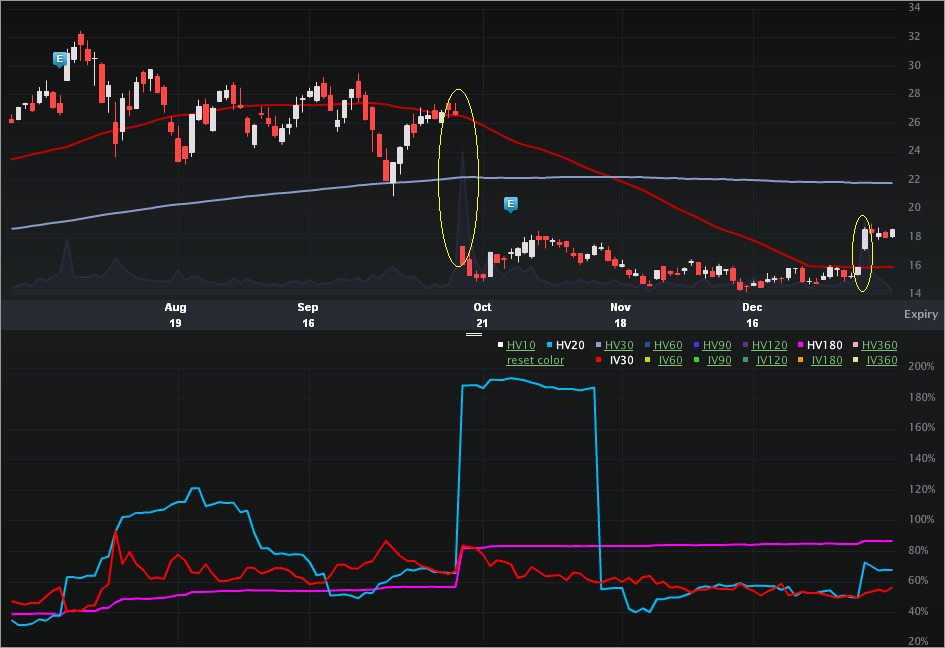
The story for CROX is rather involved over the last few months. Let’s turn to the Charts Tab (6 months), below. The top portion is the stock price, the bottom is the vol (IV30™ - red vs HV20 - blue vs HV180 - pink).
On the stock portion we can see the abrupt gap down on 10-18-2011, when the stock dropped from $26.64 to $16.15 close-to-close in one day or a 39% move. The news driving that reaction was a pre-announcement that Q3 forecasts would be missed on realized revenue of $265 million and earnings of $0.31-$0.33 / share (Source: Seeking Alpha via yahoo! Finance -- Crocs: Benefit From Market Inefficiency, written by Robert Broens). Here’s where it gets funky:
In July 2011, analysts expected $0.32 / share and revenue of $265 million... Umm, those numbers sound familiar?
But... Before that, CROX came out and raised forecasts to $280 million and $0.40 / share in earnings. On that day the underlying jumped from $26.76 to $30.92 (close-to-close). So the “miss” was in fact the exact level that analysts originally expected (kudos to the analysts).
Fast forward to Jan of this year, and CROX pre-announced that Q4 results would come at the high end of the forecasts, and the stock popped again. Finally, we saw the news (or lack thereof) today and the stock and vol pop.
Looking back to the Charts Tab and focusing on the vol portion, we can see that the implied is trading at a significant discount to the two historical realized measures. Or, in English, the options reflect less stock volatility moving forward than the stock has had both in the last 20 trading days and the last 180 trading days.
Specifically:
IV30™: 59.89%
HV20™: 68.17%
HV180™: 86.63%
Given the recent movement in CROX and rather unsure footing of their forecasts, that seems… odd…
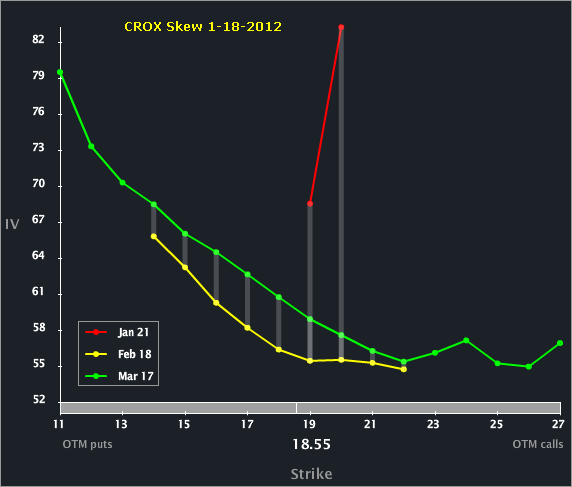
Let’s turn to the Skew Tab.
We can see that Jan vol is elevated to the back months and that the skew in Jan reflects upside potential. The next earnings report for CROX is due out at the end of Feb, but after Feb expiry (so, in Mar options but not Feb). That volatility event is priced into the Mar options and thus the “green line” lies on top of the “yellow line.”
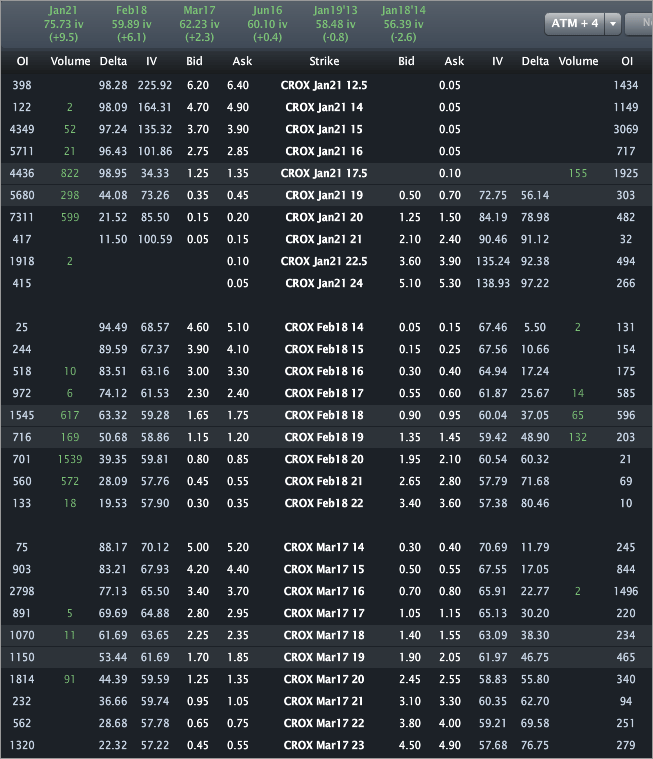
Finally, let’s turn to the Options Tab.
I wrote about this one for TheStreet (OptionsProfits), so no specific trade analysis here. But, we can see the action in the Feb 20 calls, where over 1,500 have traded. The prices are a bit ambiguous with respect to reflecting purchases or sales, but the circumstantial evidence (vol up, stock up) points to vol (options) purchases. The vols for the front three months are 75.73%, 59.89% and 62.23%, respectively. That Mar vol with earnings is interesting as are those three day options in Jan.
This is trade analysis, not a recommendation.
- English (UK)
- English (India)
- English (Canada)
- English (Australia)
- English (South Africa)
- English (Philippines)
- English (Nigeria)
- Deutsch
- Español (España)
- Español (México)
- Français
- Italiano
- Nederlands
- Português (Portugal)
- Polski
- Português (Brasil)
- Русский
- Türkçe
- العربية
- Ελληνικά
- Svenska
- Suomi
- עברית
- 日本語
- 한국어
- 简体中文
- 繁體中文
- Bahasa Indonesia
- Bahasa Melayu
- ไทย
- Tiếng Việt
- हिंदी
CROCS Inc. (CROX) - Stock and Vol Pop, Positive Guidance... Again
Published 01/19/2012, 02:37 AM
Updated 07/09/2023, 06:31 AM
CROCS Inc. (CROX) - Stock and Vol Pop, Positive Guidance... Again
Latest comments
Loading next article…
Install Our App
Risk Disclosure: Trading in financial instruments and/or cryptocurrencies involves high risks including the risk of losing some, or all, of your investment amount, and may not be suitable for all investors. Prices of cryptocurrencies are extremely volatile and may be affected by external factors such as financial, regulatory or political events. Trading on margin increases the financial risks.
Before deciding to trade in financial instrument or cryptocurrencies you should be fully informed of the risks and costs associated with trading the financial markets, carefully consider your investment objectives, level of experience, and risk appetite, and seek professional advice where needed.
Fusion Media would like to remind you that the data contained in this website is not necessarily real-time nor accurate. The data and prices on the website are not necessarily provided by any market or exchange, but may be provided by market makers, and so prices may not be accurate and may differ from the actual price at any given market, meaning prices are indicative and not appropriate for trading purposes. Fusion Media and any provider of the data contained in this website will not accept liability for any loss or damage as a result of your trading, or your reliance on the information contained within this website.
It is prohibited to use, store, reproduce, display, modify, transmit or distribute the data contained in this website without the explicit prior written permission of Fusion Media and/or the data provider. All intellectual property rights are reserved by the providers and/or the exchange providing the data contained in this website.
Fusion Media may be compensated by the advertisers that appear on the website, based on your interaction with the advertisements or advertisers.
© 2007-2025 - Fusion Media Limited. All Rights Reserved.
