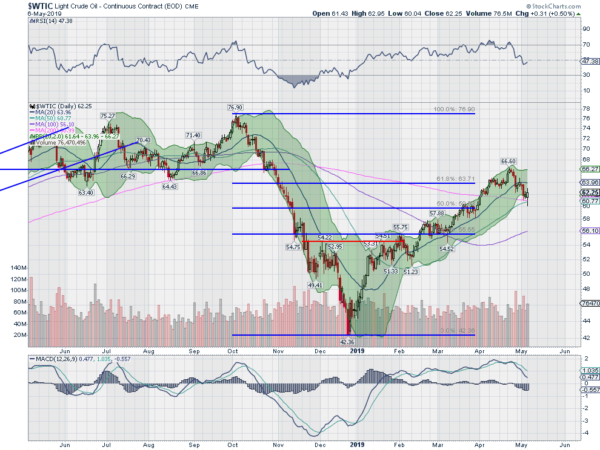
Crude oil has had a strong run to start 2019. Rising from a bottom at the end of 2018, it went straight up for 4 months to a top in mid-April. But it has pulled back since. The pullback did not find support at the 20 day SMA this time, like it had the previous 3 times. Instead, this time it continued lower. And now crude is at a critical juncture.
The chart below shows that crude is now sitting on the 200 day SMA and the 50 day SMA. It is also at the lower Bollinger Band® as the bands may be opening. The RSI has reset and is now below the mid line while the MACD continues lower. All of these support a continued move to the downside.

But these indicators when looked at en masse can be read quite differently. First the 50 day SMA and 200 day SMA are about to print a Golden Cross. That is the 50 day SMA crossing up through the 200 day SMA and is quite bullish. Second, the Hammer candle printed Monday at the lower Bollinger Band suggest a possible reversal. And the momentum resets have left the indicators still in bullish territory.
Where the easier path remains to the downside the chart has reset for another massive move higher should it reverse here. Which will it be? We will have to wait and see.
The information in this blog post represents my own opinions and does not contain a recommendation for any particular security or investment. I or my affiliates may hold positions or other interests in securities mentioned in the Blog, please see my Disclaimer page for my full disclaimer.
