Crestmont Market Valuation Update

Published 07/01/2013, 01:55 PM
Updated 07/09/2023, 06:31 AM

The 2011 article P/E: Future On The Horizon by Advisor Perspectives contributor Ed Easterling provided an overview of Ed's method for determining where the market is headed. His analysis was quite compelling. Accordingly I include the Crestmont data to my monthly market valuation updates.

The first chart is the Crestmont equivalent of the Cyclical P/E10 ratio chart I've been sharing on a monthly basis for the past few years.
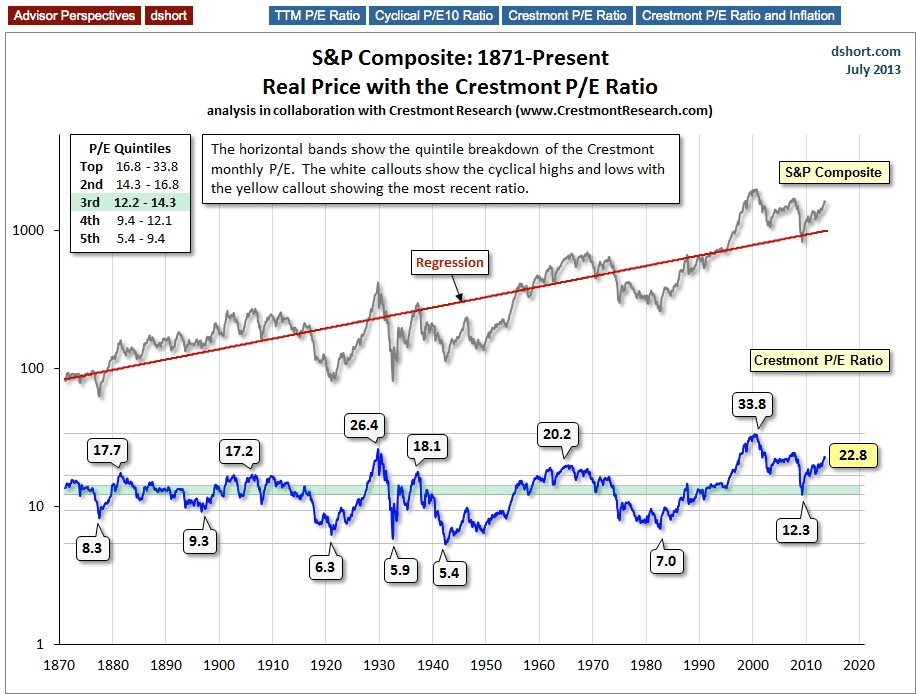
The S&P 500 And P/E Ratio
The Crestmont P/E of 22.8 is 66% above its average (arithmetic mean) of 13.8. This valuation level is similar to the 62% we see in the latest S&P Composite regression to trend update and higher than the 39% above mean for the Cyclical P/E10 (more here).

The Crestmont P/E of 22.8 puts the current valuation at the 95th percentile of this fourteen-decade series.

Because inflation is a key driver for direction of P/E multiples, I occasionally update this chart twice a month if the mid-month release of the Consumer Price Index marks a significant change in the annualized rate of inflation.
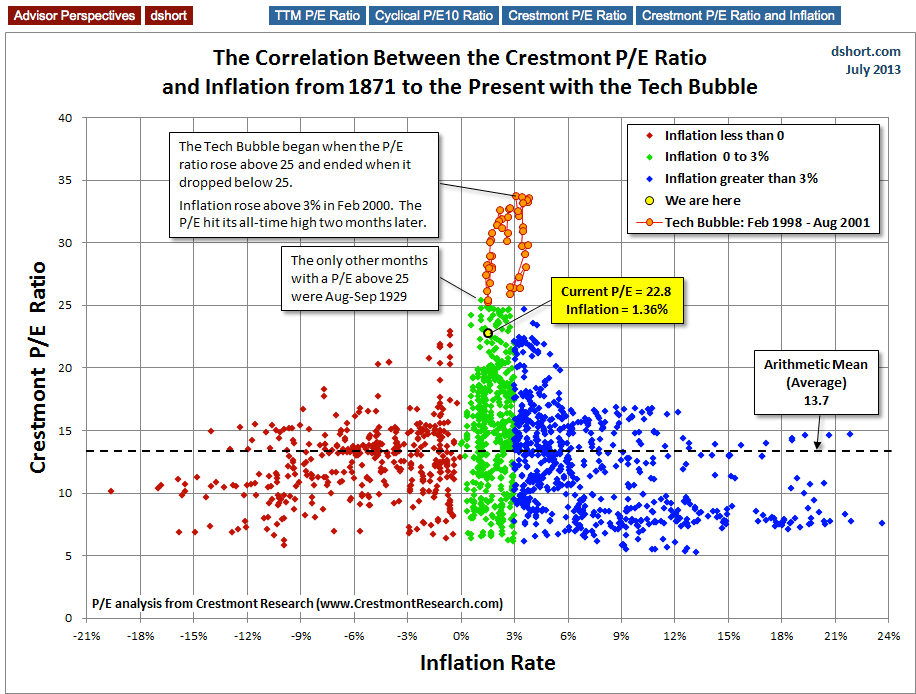
Historic P/E And The Tech Bubble
For a better understanding of these charts, please see Ed's two-part commentary here:

And these articles explore key concepts for investment expectations and planning.


Latest comments

Loading next article…
Risk Disclosure: Trading in financial instruments and/or cryptocurrencies involves high risks including the risk of losing some, or all, of your investment amount, and may not be suitable for all investors. Prices of cryptocurrencies are extremely volatile and may be affected by external factors such as financial, regulatory or political events. Trading on margin increases the financial risks.
Before deciding to trade in financial instrument or cryptocurrencies you should be fully informed of the risks and costs associated with trading the financial markets, carefully consider your investment objectives, level of experience, and risk appetite, and seek professional advice where needed.
Fusion Media would like to remind you that the data contained in this website is not necessarily real-time nor accurate. The data and prices on the website are not necessarily provided by any market or exchange, but may be provided by market makers, and so prices may not be accurate and may differ from the actual price at any given market, meaning prices are indicative and not appropriate for trading purposes. Fusion Media and any provider of the data contained in this website will not accept liability for any loss or damage as a result of your trading, or your reliance on the information contained within this website.
It is prohibited to use, store, reproduce, display, modify, transmit or distribute the data contained in this website without the explicit prior written permission of Fusion Media and/or the data provider. All intellectual property rights are reserved by the providers and/or the exchange providing the data contained in this website.
Fusion Media may be compensated by the advertisers that appear on the website, based on your interaction with the advertisements or advertisers.
© 2007-2025 - Fusion Media Limited. All Rights Reserved.