Cree, Inc. (CREE) develops and manufactures semiconductor materials and devices primarily based on silicon carbide (SiC), gallium nitride (GaN) and related compounds.
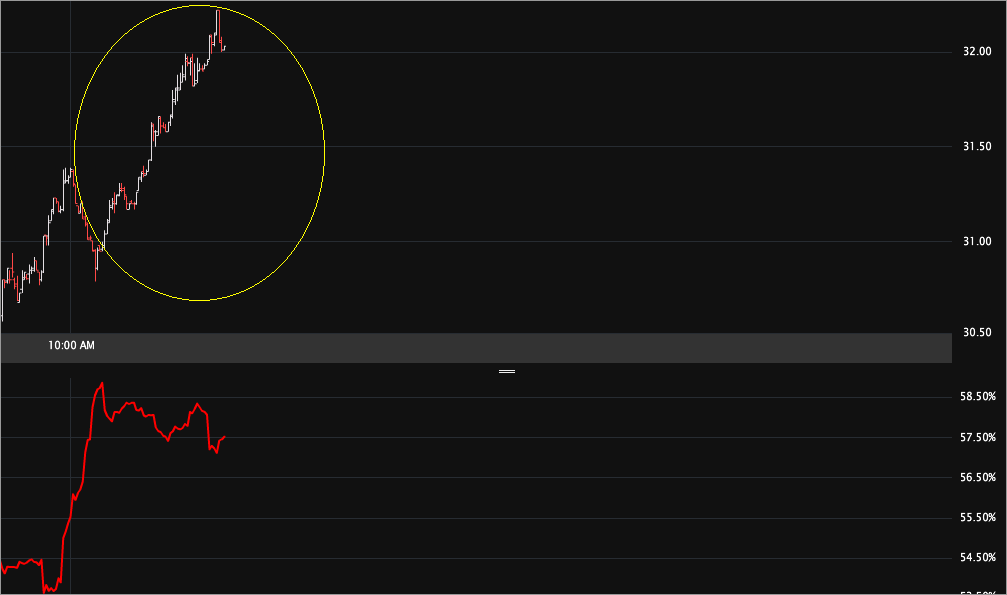
This is a vol note in a spiking stock with earnings approaching. Let's start with the tick chart, below. The top portion is the stock price, the bottom is the vol for the Apr expiry.
I've highlighted that stock pop this morning. It's interesting that the vol popped as well, but then has fallen off as the stock kept rising.
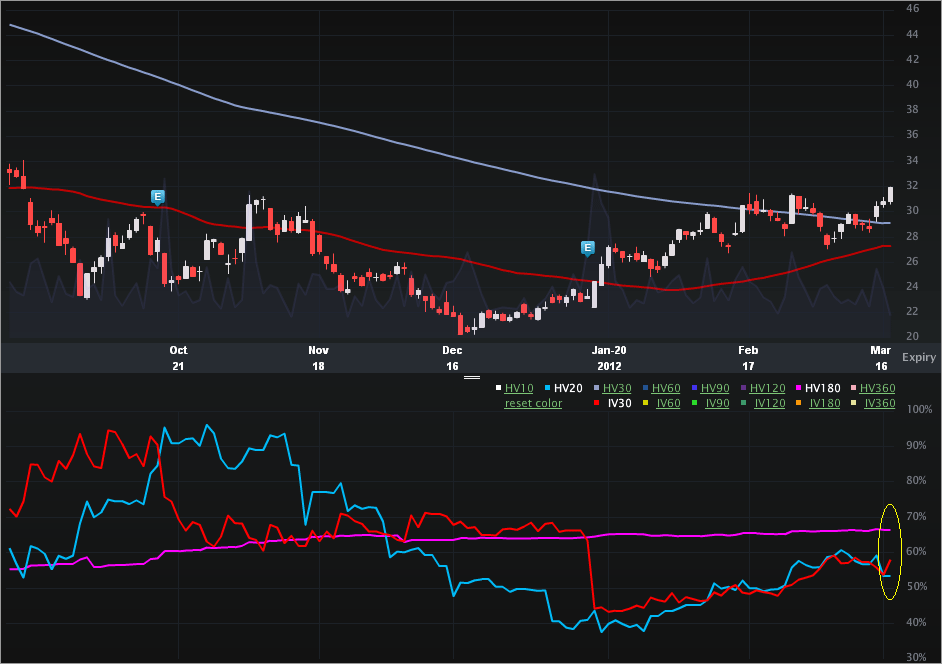
Let's turn to the Charts Tab (six months), below. The top portion is the stock price, the bottom is the vol (IV30™ - red vs HV20™ - blue vs HV180™ - pink).
On the stock side, we can see the underlying has risen to a near six month high. On the vol side, while the implied is still depressed relative to its history (33rd percentile annual), the move today has pushed it above the short-term historical vol (HV20™). The vol comps are:
IV30™: 58.10%
HV20™: 53.35%
HV180™: 66.45%
The 52 wk range in IV30™ is [39.61%, 94.84%].
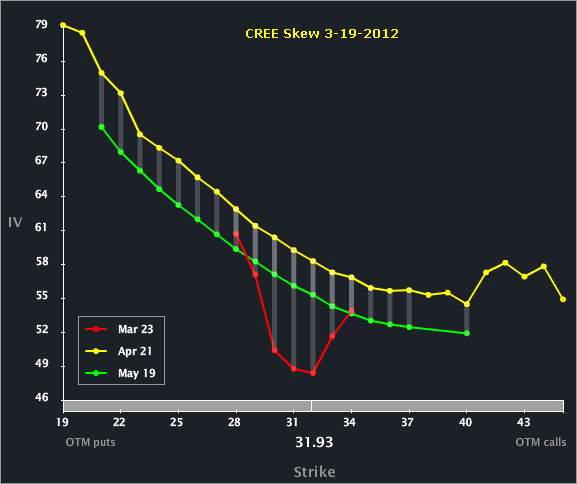
Let's turn to the Skew Tab.
Interestingly, as the stock has pushed higher and vol has increased with the stock, the Mar (W) expiry is priced to the lowest vol of the front three expiries. Apr is priced above May. We're projecting the next earnings release for CREE is 4-17-2012, so vol should be rising into that expiration.
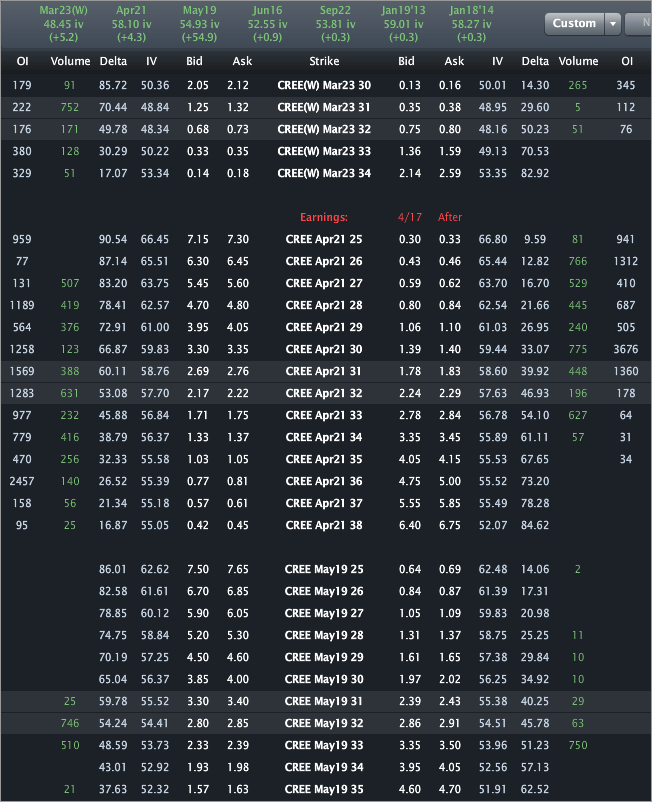
Let's turn to the Options Tab, for completeness.
The option market reflects a vol event (probably earnings) in the Apr expiry. The vols are priced to 48.45%, 58.10% and 54.93% for Mar23 (W), Apr and May, respectively. The 52 wk range in stock price for CREE is [$20.25, $50.58]. Note the pricey downside skew (over 70%) in Apr as earnings approach.
This is trade analysis, not a recommendation.
- English (UK)
- English (India)
- English (Canada)
- English (Australia)
- English (South Africa)
- English (Philippines)
- English (Nigeria)
- Deutsch
- Español (España)
- Español (México)
- Français
- Italiano
- Nederlands
- Português (Portugal)
- Polski
- Português (Brasil)
- Русский
- Türkçe
- العربية
- Ελληνικά
- Svenska
- Suomi
- עברית
- 日本語
- 한국어
- 简体中文
- 繁體中文
- Bahasa Indonesia
- Bahasa Melayu
- ไทย
- Tiếng Việt
- हिंदी
Cree: Vol Up, Stock Up, Earnings Approaching
Published 03/20/2012, 04:32 AM
Updated 07/09/2023, 06:31 AM
Cree: Vol Up, Stock Up, Earnings Approaching
Latest comments
Loading next article…
Install Our App
Risk Disclosure: Trading in financial instruments and/or cryptocurrencies involves high risks including the risk of losing some, or all, of your investment amount, and may not be suitable for all investors. Prices of cryptocurrencies are extremely volatile and may be affected by external factors such as financial, regulatory or political events. Trading on margin increases the financial risks.
Before deciding to trade in financial instrument or cryptocurrencies you should be fully informed of the risks and costs associated with trading the financial markets, carefully consider your investment objectives, level of experience, and risk appetite, and seek professional advice where needed.
Fusion Media would like to remind you that the data contained in this website is not necessarily real-time nor accurate. The data and prices on the website are not necessarily provided by any market or exchange, but may be provided by market makers, and so prices may not be accurate and may differ from the actual price at any given market, meaning prices are indicative and not appropriate for trading purposes. Fusion Media and any provider of the data contained in this website will not accept liability for any loss or damage as a result of your trading, or your reliance on the information contained within this website.
It is prohibited to use, store, reproduce, display, modify, transmit or distribute the data contained in this website without the explicit prior written permission of Fusion Media and/or the data provider. All intellectual property rights are reserved by the providers and/or the exchange providing the data contained in this website.
Fusion Media may be compensated by the advertisers that appear on the website, based on your interaction with the advertisements or advertisers.
© 2007-2025 - Fusion Media Limited. All Rights Reserved.
