Summary
- It appears the yield curve is done rising for now.
- The increase in commercial paper spreads has not infected other higher risk areas of the credit market.
- Financial stress indexes are lower.
Let's start by looking at two comparisons of the yield curve:
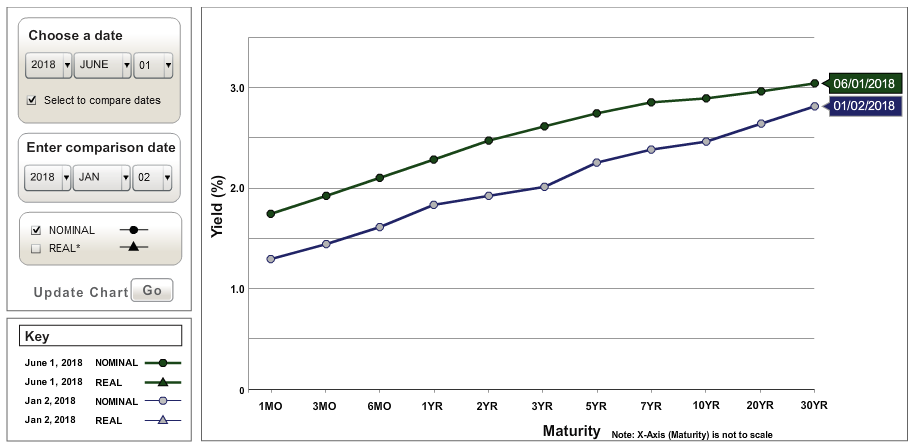
The chart above shows the yield curve at the beginning of the year and compares it to Friday's close, during which all sections of the curve had moved higher. But the short-end has increased more, as this part of the curve has risen in sympathy with the Fed's rate hiking policy.
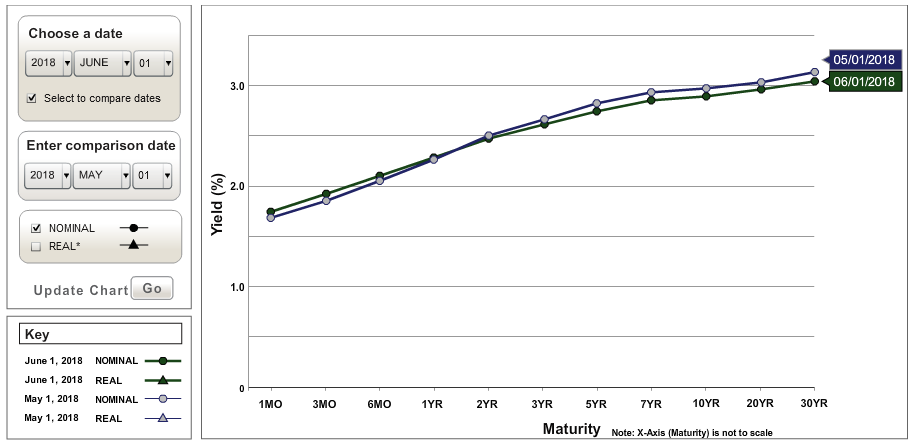
The chart above shows the yield curve's movement over the last month. There hasn't been much movement, which shows that the curve has more or less adjusted to a new economic reality.
And just what is that "new economic reality?" First off, the Fed is obviously raising rates (duh). According to the latest dot plot, there's a possibility of four rate hikes this year. But the long end of the curve hasn't really moved much higher, indicating there is still little concern about inflationary pressures. This also means bond traders don't see an acceleration in economic growth; instead, they believe the economy will experience more "modest and moderate" activity. This is confirmed by the still contained nature of inflationary expectations:
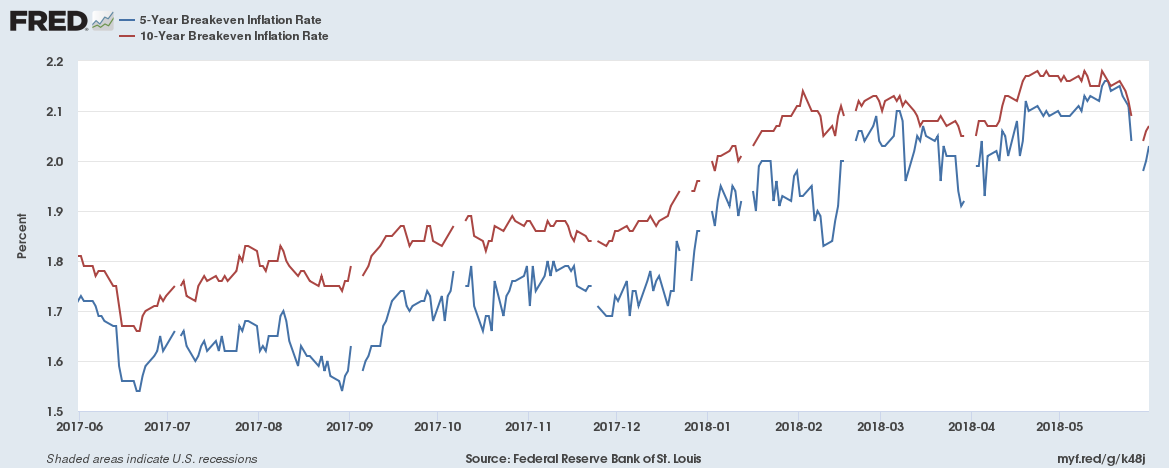
Both the five and ten-year inflation expectations measures, derived from bond market yields, are still very low. As of now, they seem settled in the lower 2% range.
This graph shows the pace of increases in the short-end of the yield curve:
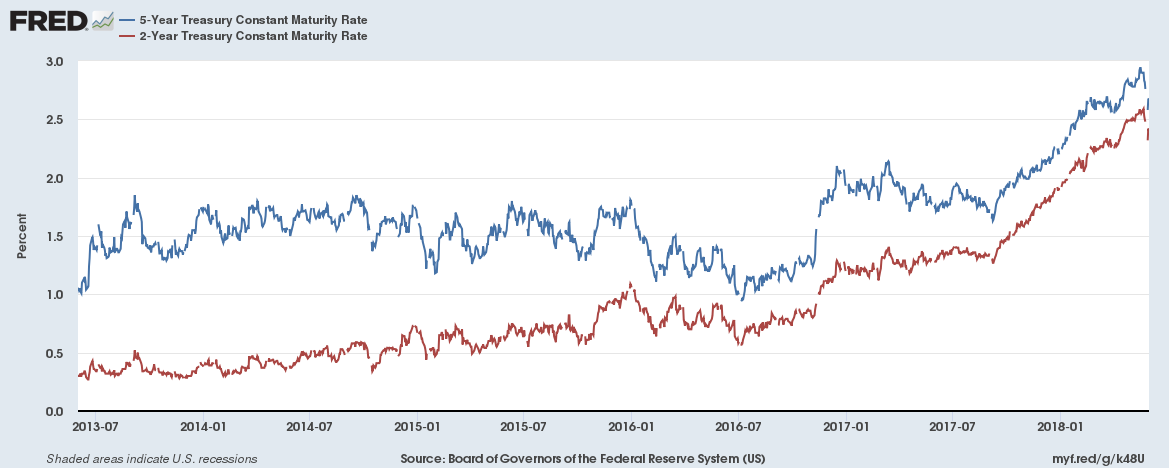
The five-year (in blue) has recently risen nearly 100 basis points as has the 2-year (in red). These are large moves for the Treasury market.
In comparison, here's a graph of rates at the long-end of the curve:
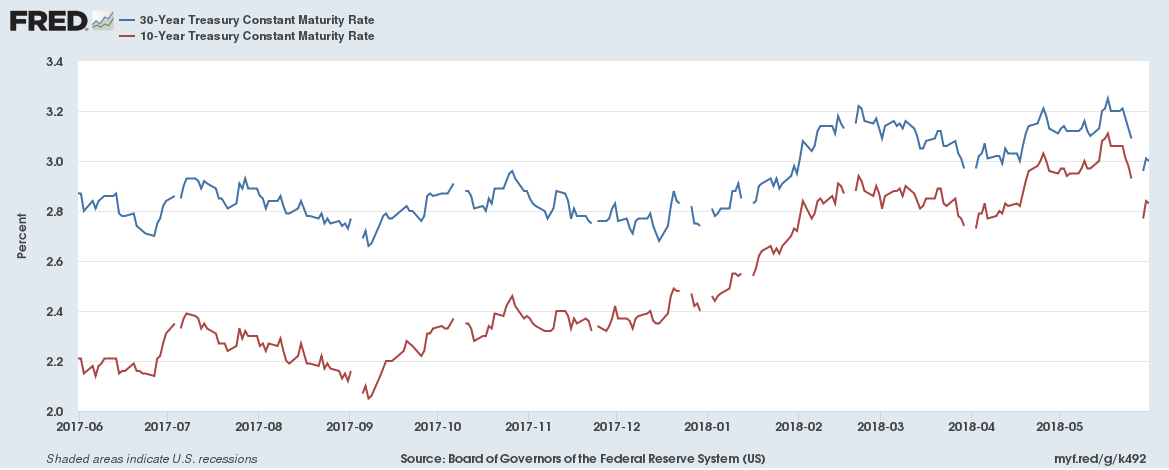
The 10-Year (in red) has increased about 60 basis points this year. In contrast, the 30-Year has barely moved; it's traded in a 20 basis point range.
As a result of all this activity, the yield curve has compressed:
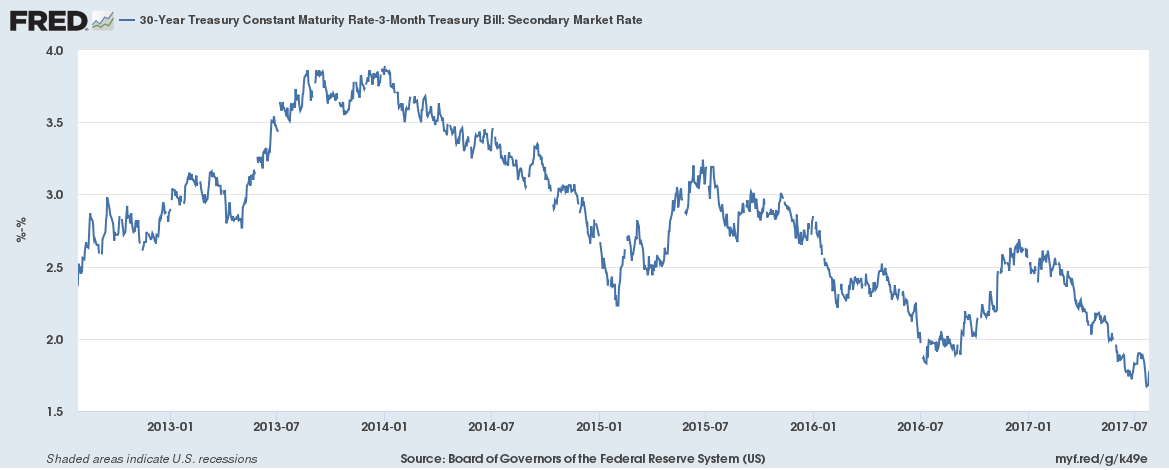
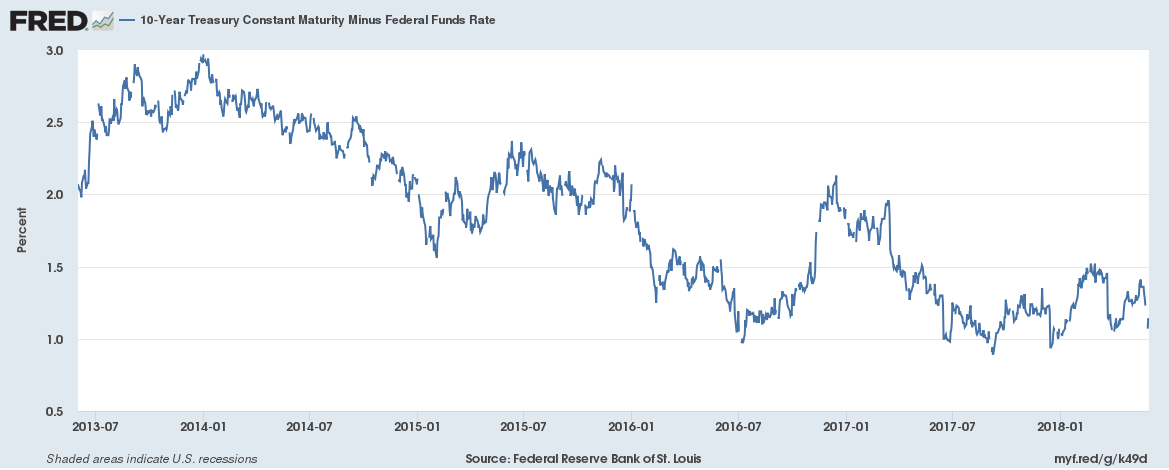
The top chart shows the 30-year-3-month spread, which is now about 1.65%. It is continuing to compress. In contrast, the 10-year-FF spread is fluctuating between 100 and 150 basis points.
A key point is this is about where the Treasury market usually is at the end of an expansion. The yield curve is not signaling a recession, it is saying we're moving closer.
A few more points. Earlier this year, the commercial paper market widened out:
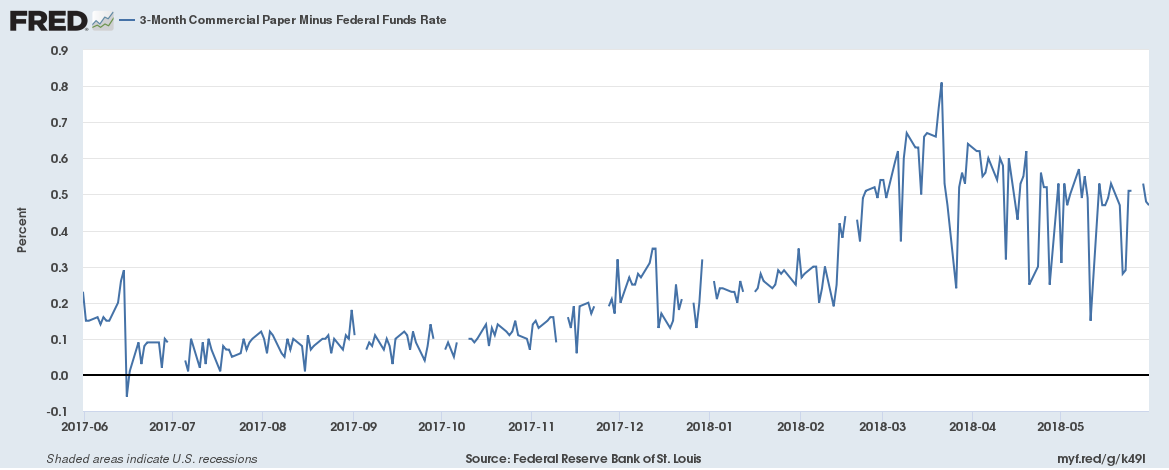
This is usually a sign of potential economic problems, signaling that companies are having a more difficult time funding short-term cash needs. This can presage a recession. However, this occurred at the same time that Congress passed the Tax Cuts and Jobs Act, which allowed companies to bring offshore money onshore. This increased deal flow in the short-term market, which spiked rates.
What didn't happen was a move higher in the junk market:
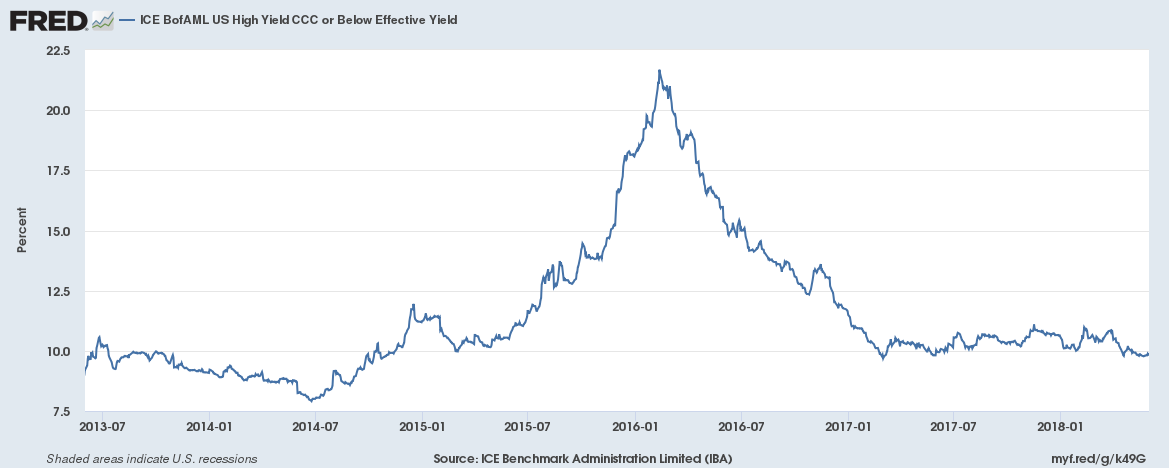
Instead, CCC section of the curve has come in a bit.
Finally, the spring market sell-off increased the amount of financial market risk. Those increases are now contained:
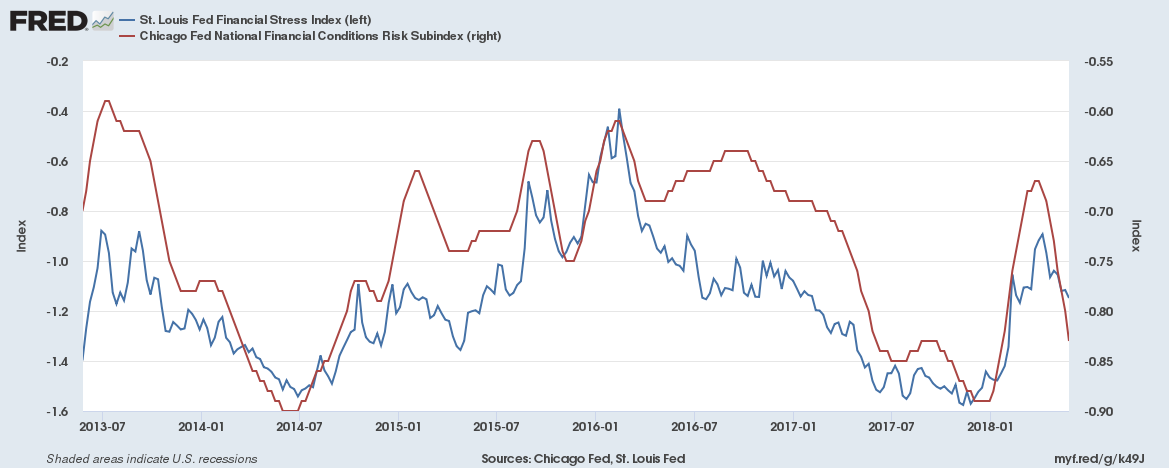
Both the St. Louis Financial Stress Index and the Chicago Fed Risk Index have moved lower.
Disclosure: I/we have no positions in any stocks mentioned, and no plans to initiate any positions within the next 72 hours.
I wrote this article myself, and it expresses my own opinions. I am not receiving compensation for it (other than from Seeking Alpha). I have no business relationship with any company whose stock is mentioned in this article.

