Recurring revenue grew by 48% to represent 44% of H1 sales, reflecting an ongoing shift to SaaS and the acquisition of Elaxy BS&S. However, due to uncertainties over the timing of new contracts and the magnitude of the shift to SaaS, management has reduced its FY19 EBITDA guidance and deferred its long-term projections until later in the year. We have cut our EBITDA forecasts by 25% in FY20 and by 26% FY21. Nevertheless, the digital banking industry dynamics remain attractive and pure-play CREALOGIX has a strong pipeline. In our view, CREALOGIX is uniquely positioned in this industry and is an attractive play on digital banking.
Interim results: 28% local currency revenue growth
H1 revenues grew by 29% to CHF51.0m, including a 1% benefit from currency movements and full period contributions from Innofis and Elaxy BS&S, which were acquired in January 2018 and July 2018 respectively. Recurring revenue grew by 48% to CHF22.3m to represent 44% of H1 group revenue. Sales outside Switzerland represented 64% of total revenue, up from 58% in H118. The EBITDA margin fell by 470bp to 6.4% but was an improvement on the H218 margin of 5.6%.
Digital banking remains in a strong growth phase
CREALOGIX has been benefiting from the open banking wave. PSD2, which came into force in January 2018, is driving the digital transformation of the financial industry across the EU. Additional rules that require banks to provide open interfaces, or APIs, for authorised third-party providers came into effect in mid-March 2019. APIs are key to creating a digital ecosystem for customers.
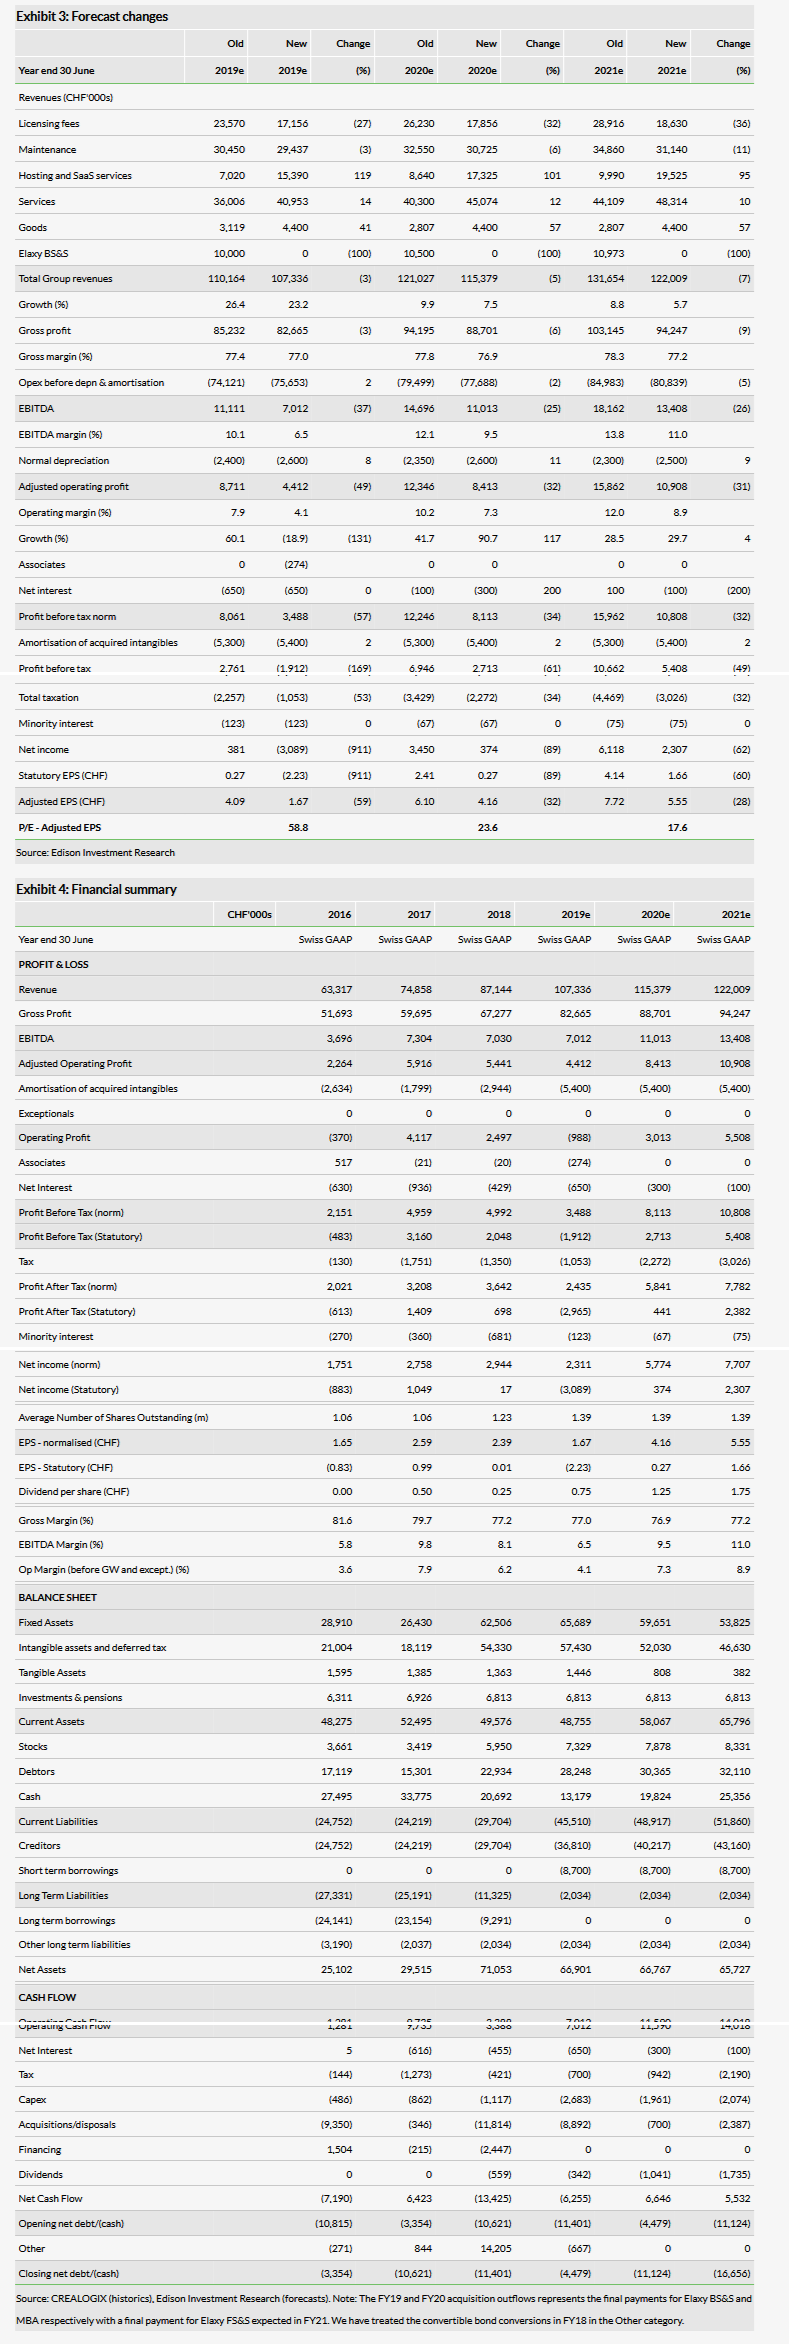
Forecast changes: EBITDA cut 25/26% in FY20/FY21
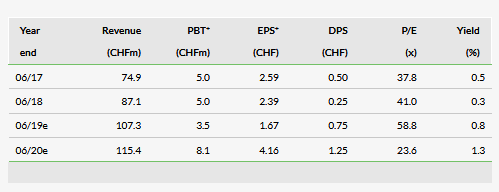
Company guidance remains for FY19 revenues to exceed CHF100m while H2 EBITDA guidance is now for at least the H1 level. We have cut our revenues by 3% in FY19 to CHF107.3m, with FY20 and FY21 coming back by 5% and 7%. We have also cut our EBITDA margins, hence EBITDA falls by 37% in FY19, 25% in FY20 and by 26%in FY21. These cuts reflect the delayed contracts and the ongoing shift to SaaS. We now forecast the group to end FY19 with net cash of CHF4.5m after the refinancing of the remaining convertible bonds in November.
Valuation: 10% revenue CAGR with 10%+ operating margins would imply substantial upside
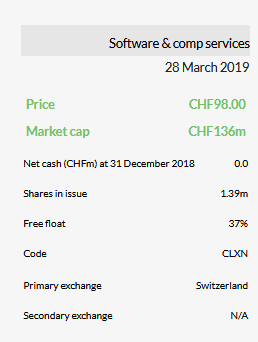
A DCF scenario incorporating 10% organic revenue CAGR over 2019–29e falling thereafter to 2%, operating margins of 10% from FY22e along with a 9% WACC would suggest a valuation of CHF148 per share, c 51% above the current share price. Increasing the margin to 15% from FY25e lifts the value to CHF209 p/sh.
Business description
CREALOGIX Group provides digital banking technology solutions to banks, wealth managers and other financial services companies. The company’s suite of solutions includes online and mobile banking, digital payments, digital learning and security.
Interim results: Switch to SaaS continues
H1 revenues grew by 28% to CHF51.0m at constant currencies, along with a 1% benefit from currency movements and full period contributions from Innofis and Elaxy BS&S, which were acquired in January 2018 and July 2018 respectively. The company did not provide organic growth figures as the new businesses are integrated and difficult to detangle. However, based on our initial forecasts of c CHF10m annual revenues for each of these acquired business, along with some modest growth at Innofis, this would suggest that H1 organic revenue growth was broadly flat.
Nevertheless, this organic growth is also clouded by the decline in (one-off) licence revenue as customers increasingly move to SaaS. We note that a CHF1m traditional perpetual licence deal would typically generate CHF1m plus 20% maintenance revenue in the first year while on a SaaS basis this would be c CHF450k (ie, CHF1,800/4) , proportionate for the period. A new SaaS contract signed on the first day of last month of the financial year will only generate CHF38k of revenue in the first financial year. However, the SaaS model is more lucrative over the long-term, breaking even after four years and generating significantly more revenue thereafter (ie CHF450k per annum compared with CHF200k per year for the perpetual licence model).
There were delays in new contract wins in H1, which management says, reflect the significantly increased deal size that CREALOGIX is signing and the longer sales cycles associated with these deals. Meanwhile the uncertainly over Brexit has been deferring decision making in the UK. Despite these issues, CREALOGIX has a strong pipeline but there are uncertainties over the timing and form (SaaS or traditional) of new deals. CREALOGIX is in negotiation with Tier 1 banks and is optimistic it will close several deals in the next few months. As a number of these are likely to be on a traditional licence basis, licensing fees are expected to recover in H2, while the form of other deals are yet to be decided and these decisions will have a significant bearing on revenues and profits.
Given the ongoing shift to the SaaS revenue model, CREALOGIX did not publish its long-term guidance in the latest results (previously >20% annual revenue growth and >15% medium term EBITDA margin) and management will review these numbers with the final results.
Nine open-banking customers were signed up during the period, of which three were new customers. Most new customers continue to choose the SaaS option, which involves lower upfront revenues, but greater revenues over the term of the contract. Consequently, this reduces the current period revenues and profitability.
Revenues in Switzerland grew by 9% while Europe grew by 30%. Spain-based Innofis, which is focused on Islamic banking, made a slow start after its acquisition, as we reported with the FY18 results, due to management focus on acquisition procedures and integration. However, management is pleased with the progress. The group is also shifting work handled by contractors in Switzerland to new permanent roles in Spain, which results in significant cost savings, but there were duplicate costs in H1 as this transition is being made. There will be c 20 new roles in place by the end of June. The group’s headcount rose by 65% over the 12 months to stand at 688 at end December, reflecting the acquisitions of Innofis and Elaxy BS&S.
Hosting and Saas services revenue jumped 184% to CHF7.6m, which includes c 50% of Elaxy BS&S revenues – Elaxy BS&S has added a significant hosting business to the group. Recurring revenue (Hosting/SaaS plus maintenance) expanded by 48% to CHF22.3m to represent 44% of H1 group revenue. Sales outside Switzerland represented 64% of total revenue, up from 58% in H118. The gross margin slipped by 360bp to 73.6%, reflecting the change in the product mix. The EBITDA margin fell from 11.1% in H118 to 6.4% in H119 but was an improvement on the H218 margin of 5.6%.
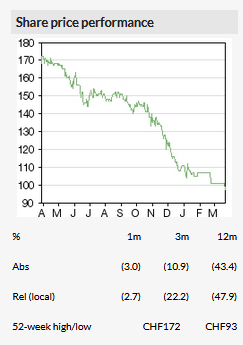
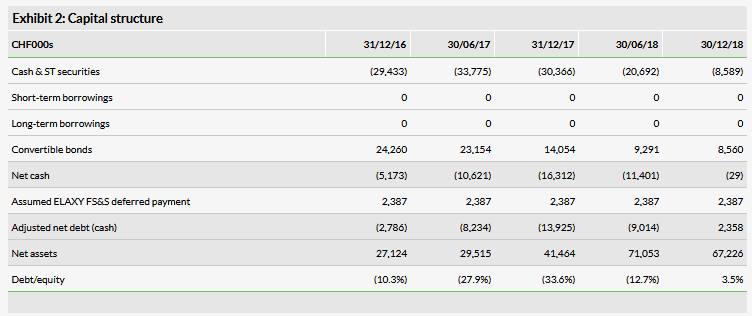
Cash fell over the six months, primarily due to the CHF8.9m acquisition of Elaxy BS&S along with a free cash outflow of CHF2.1m (CHF2.8m outflow in H118). There was a CHF4.8m working capital outflow – we note that December is the low point is the cash flow cycle with most maintenance revenue collected in January - and increased capital investment of CHF1.6m that mainly related to investment in IT infrastructure in Switzerland (CHF1.1m). In addition, we note the group spends c 20% of revenues on R&D, all of which is expensed as incurred. Net assets declined due to the statutory loss and currency movements. The outstanding convertible bonds are due in October and the company plans to refinance them. These bonds convert at CHF104.5 which is slightly above the current share price.
Forecasts: Revenues and EBITDA cuts
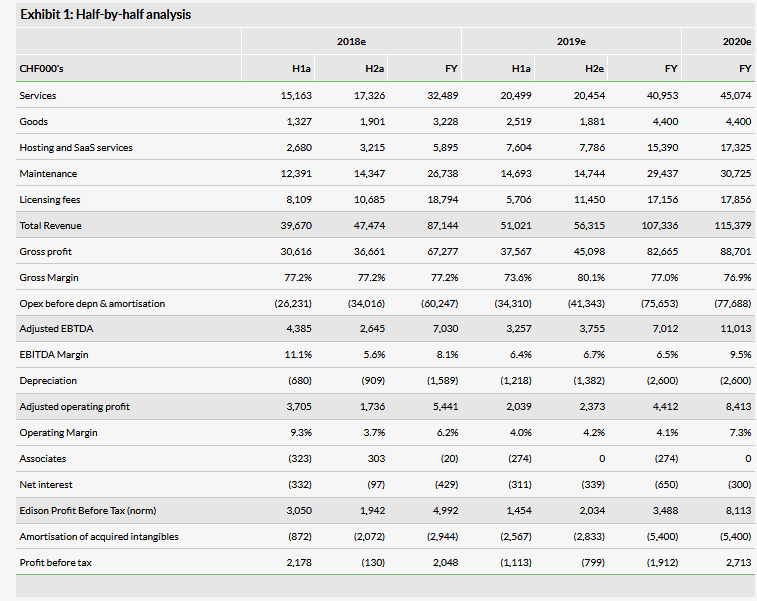
Company guidance is for FY19 revenues to exceed CHF100m and H2 EBITDA of at least the H1 level. Consequently, we have eased our revenues by 3% in FY19 to CHF107.4m, with FY20 and FY21 coming back by 5% and 7% to CHF115.4m and CHF122.0m respectively. We have cut our EBITDA margins by 360bp in FY19, 260bp in FY20 and 280bp in FY21, but we continue to forecast the margin to expand as the SaaS revenue book gains scale. Hence our EBITDA falls by 37% in FY19 to CHF7.0m, 25% in FY20 to CHF11.0m and by 26% in FY21 to CHF13.4m. We have reallocated Elaxy BS&S to the appropriate revenue types, which primarily affected hosting (c 50% of revenues), but is also reflected in services. We have shifted our goods (hardware) forecasts higher, due to significantly higher than expected sales in H1, but these are related to one-off contracts and we continue to forecast this category to flatline, albeit from a higher level. Associates represents Qontis and we have adjusted FY19 associates for the CHF274k loss although we assume breakeven going forward. We have maintained our interest costs and tax rate assumptions. We now forecast the group to end FY19 with net cash of CHF4.5m (previously CHF10.3m), which rises to CHF11.1m at end FY20 and to CHF16.7m at end FY21. We now assume the remaining convertible bonds will be refinanced in November with debt.
