Oh, Janet. We hope you are right. One should never say never—that has a nasty habit of coming back to bite you.
Texas and Houston are currently going through their crash. No, not a stock market crash but a hurricane and flooding crash. Hurricane Harvey has been called a “once in 500 years’ event.” Except in the past twelve years, we have also had Hurricane Katrina and Sandy. They were called “once in 100 years events.”The 400-yeardifference seems moot. It is becoming a little flippant to call them “once in a lifetime” events when three“lifetime” events have occurred in twelve short years. Yet, for all of them the experts did not see the devastation that was coming.
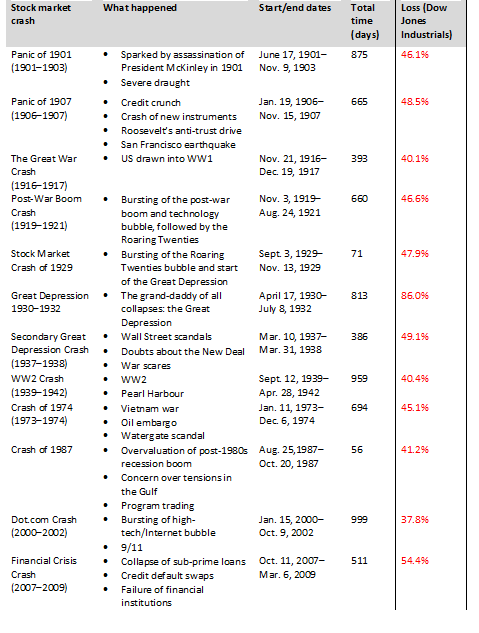
And so it is with stock market crashes. That is why we don’t believe that Janet Yellen should be so sanguine that another one won’t happen in our lifetime. Since 1900, at least twelve have occurred. Most, if not all, were not predicted by economists, central bankers, media, or politicians. Those that did predict a coming crash were usually called charlatans, doomsayers, cranks, perma-bears, and worse. We’ve been called perma-bears. Frankly, we prefer to call our viewpoint cautious optimism. We’ve also been called a gold-bug but that is another story.
The twelve crashes since 1900 we can cite are as follows:

The average is about one every ten years. However, of the twelve cited above only four have occurred since 1970. There have also been a number of mini-collapses of varying degrees over the years. Most of them have occurred in the past 50–60 years. Mini-crashes or sharp corrections of about 20% or more occurred in 1960, 1962, 1966, 1982, 1989, 1990,1997, and 1998. Before that we saw lesser corrections in 1911, 1923, 1934, 1946, 1953, and 1957. Add it all up and that points to corrections of at about 20% or more roughly every five years vs. every 10 years for big corrections of 35% or more. Given we are now up for eight years with no correction exceeding 20%—note two smaller ones of 17% and 15% in 2011 and 2015–2016—we may be overdue for something bigger.
Since the financial crisis of 2007–2009, economic growth in the western economies (EU, North America, Japan) has been below average despite years of zero to sub-zero interest rates, trillions of dollars of quantitative easing (QE), and a massive increase in debt. Janet Yellen seems to believe we have conquered the business cycle because of the work of the major central banks. But have we?
We have seen a number of articles recently calling for a looming stock market crash. It is easy to point out the potential reasons that could spark a stock market crash. Some are listed below:
- Valuation 1: as measured by the Schiller PE ratio (currently at 30) it is at least equal to the level seen at the top in 1929 and well above the high of 2007, but below the high of almost 45 seen before the dot.com crash of 2000–2002. Some argue it is not that bad given the current low interest rate environment. Further trading volumes are considerably lower today than they were before the 2007–2009 financial crisis, suggesting that despite everything the market is not in a bubble.
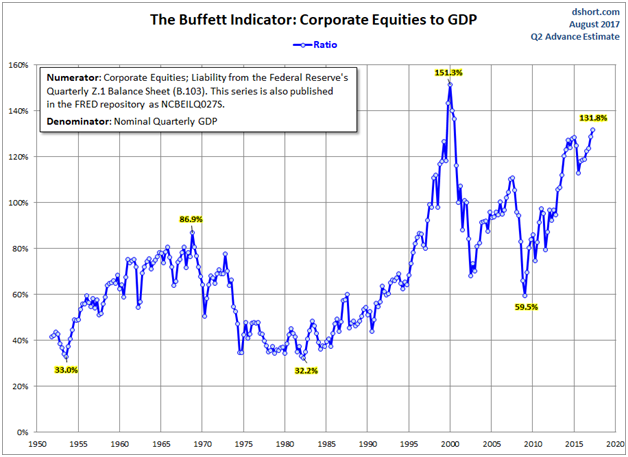
- Valuation 2: the Warren Buffet Indicator is a long-term valuation indicator that compares market cap of the stock market to GDP. As with the Shiller PE ratio, the Buffet Indicator hit a record high before the dot.com crash of 2000–2002. At that point, the stock market, market cap was at 151.3% of GDP. Today it is at 131.8%, the highest level since the 2000 high and well above the level seen before the 2007–2009 financial crisis crash. Naturally, the indicator could go higher as could the Shiller PE ratio. They are warning signs, not absolutes.
- Time: as noted, the market has now been up for eight years with no major correction (except for the two noted in 2011 at 17% and 2015–2016 at 14.5%). That is 3,097 days to August 31, 2017 without a correction exceeding 20%. The great bull market of 1990–2000 lasted 3,382 days with only one significant correction in 1998 of 19.3% and the lesser Asian Financial crisis correction in 1997 when the DJI fell roughly 14%. Bull markets do not last forever. And the longer they go on the more likely they are to end in a crash.
- Debt: global debt has climbed to an estimated $230 trillion, up at least $80 trillion from levels seen back in 2007 before the 2007–2009 financial crisis collapse. China, along with emerging economies,have been responsible for a huge portion of the debt growth and that has helped fuel not only the Chinese economy but also the Western economies (US, Britain, Eurozone, Japan, etc.) and the global stock markets.Global debt today is roughly 330% of global GDP. Much of the debt was borrowed in US$,not the home currency of the country borrowing thus increasing foreign exchange risk. Global debt has been growing at roughly 5% annually vs. 3% growth annually for global GDP.
- An “out of the blue” event: this one is difficult to pinpoint. It is unknown at this time what economic effect Hurricane Harvey might have on US GDP. Tensions with North Korea are grabbing headlines with constant threats by the US and the West that “talk with them is over.” But any attack on North Korea would bring China into the war and suddenly the world could be plunged into a global war. Negative news on Trump and Russia is also becoming regular and if something is revealed there or if indictments come down it could spark a stock market panic. September is a key month with the US debt ceiling and budget to be in place by September 29, 2017. Failure to pass could spark a stock market panic as the potential for a government shutdown looms (setting aside that funds would then not be available to bail out Texas from Hurricane Harvey).

So will there be a stock market crash? Numerous signs point to the possibility of an unexpected shakedown. Recently the VIX volatility indicator spiked following the drop seen on August 10, 2017 and again on August 17, 2017. The VIX reached its highest levels since May2017 but well under the levels seen in February 2016, the last significant high. This was nowhere near the levels reached in October–November 2008 at the time of the financial crisis crash. We have come through a long period of a very low VIX that even hit a record low in July. Fear and greed are what drive markets and for quite some time greed and complacency have ruled.
Two of the stock market crashes noted above were actually quite short. However, their impact lingered for more than a few years. The stock market crash of 1929 lasted 71 days while the stock market crash of 1987 lasted only 56 days before a bottom was found. That was their only similarity as the impact of the 1929 crash lasted a decade through the Great Depression. Following a recovery into April 1930 the stock market began a descent that remains the most vicious stock market collapse in US history. Many thought the 1987 crash would usher in a new Great Depression. It didn’t as the market laboured upwards before suffering a setback in 1990 that was the final one before the onset of the great bull market of 1990s.
One thing these two crashes did have in common was the time that elapsed between the peak and the crash. In 1929 the stock market peaked on September 3, 1929 and 55 days later the crash was under on October 28, 1929. Fast-forward to 1987 and the stock market peaked on August 25, 1987 and, yes, 55 days later on October 19, 1987 the crash occurred. The number 55 is a part of the Fibonacci series. Out of curiosity, we looked at 2017. The stock market peaked on August 8, 2017. 55 days later is October 2, 2017. The debt ceiling and budget are to be in place by September 29, 2017. October 2, 2017 is the Monday following September 29, 2017. One might wish to treat the period with some caution if it starts to become clear that the debt ceiling and budget will not be passed. A government shutdown could follow. But could the stock market also crash as a response?
As we go into the Labour Day weekend, the stock market is once again clawing back. Will it make new highs? It is possible and that would throw out the numbers noted in the previous paragraph. The reality is, however, that the warning signs are flashing and events are coming together that could create the perfect storm. Then Janet Yellen’s prediction would lie in tatters.
Disclaimer : David Chapman is not a registered financial advisor, nor an exempt market dealer (EMD). We do not and cannot give individualized market advice. The information in the newsletter is only intended for informational and educational purposes. It should not be considered a solicitation of an offer or sale of any security. The reader assumes all risk when trading in securities and David Chapman advises consulting a licensed professional financial advisor before proceeding with any trade or idea presented in this newsletter. David Chapman may take a position and sell a position in any security mentioned in this newsletter. We share our ideas and opinions for informational and educational purposes only and expect the reader to perform due diligence before considering taking a position in any security. That includes consulting with your own licensed professional financial advisor.