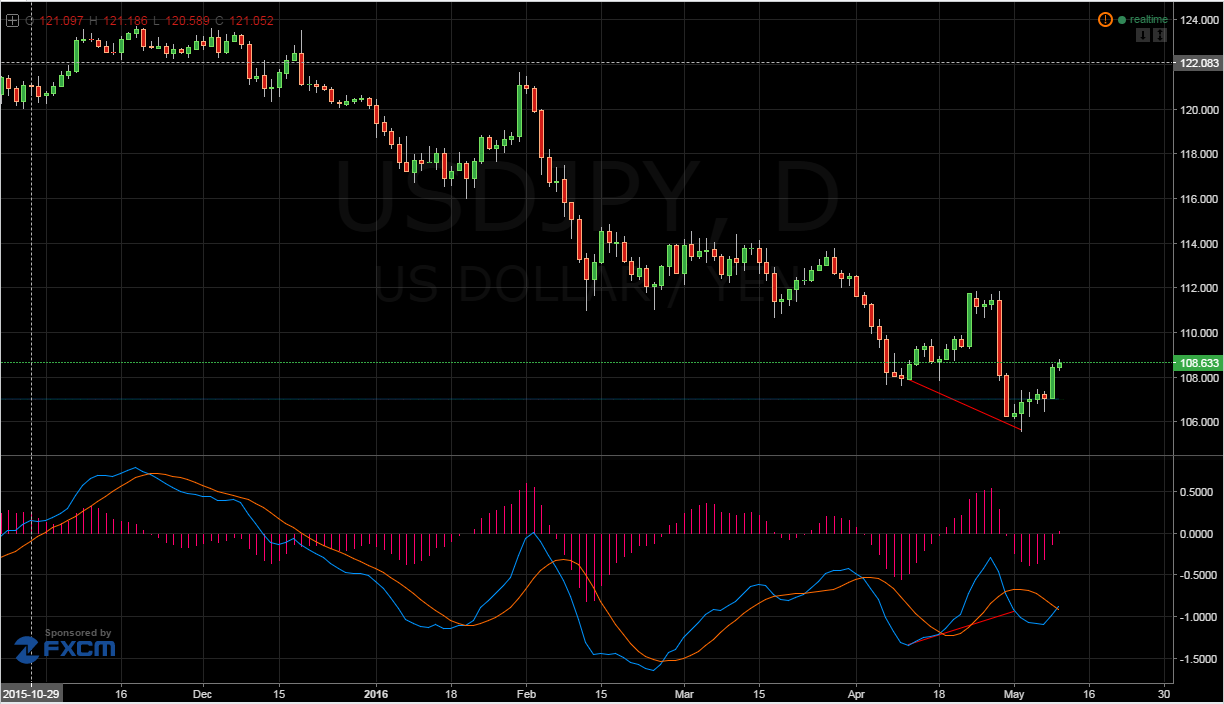
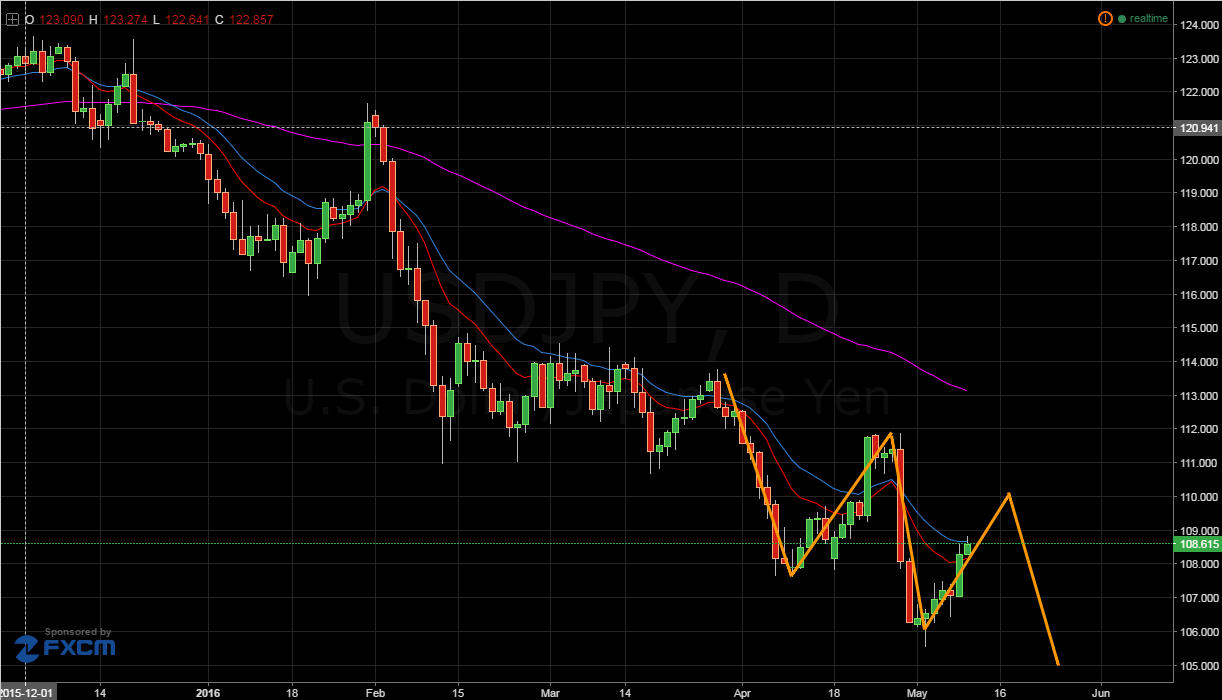
The recent USD/JPY rally has come as somewhat of a surprise given the relatively strong Japanese indicator results released early this week. Whilst a Bullish USD is giving hope to some traders, the pair’s recovery might be short-lived if an impulse wave completes. Moreover, a weak MACD divergence signal might be giving false hope for a trend reversal.
Looking at the daily chart, the current retracement for the pair is going against the 100 day EMA trend. Interestingly, there is little in the way of fundamental indicator releases or jawboning which might be applying buying pressure to the USD/JPY. Furthermore, overbought stochastic oscillator readings are being largely ignored by the market. As perplexing as it seems, there could be some technical explanations for the current rally.

Possible MACD divergence on the daily chart may have stirred up the bulls and subsequently caused the short term rally. This could account for why the pair appears to have rallied out of nowhere, bullish traders taking the divergence as a signal that the bearish trend is reversing. However, upon closer inspection the potential divergence disappears on shorter time frame charts. As a result, one might question the upside potential of the present rally and be doubtful that the downtrend has truly reversed
Consequently, the current rally is unlikely to push much higher and the pair will probably run out of momentum as it approaches the next inflection point. Presently, 12 and 20 period EMA’s on the H4 chart are relatively bullish which could provide the requisite drive to keep the pair climbing towards said point of inflection. However, stochastics are already overbought which might signal that the USDJPY is nearly ready to have a bearish reversal.

As the pair reaches the 110.00 handle, divergence will once again be watched closely again as it could signal a trend continuation or a legitimate trend reversal. If the pair doesn’t appear to be slowing and divergence isn’t heralding an imminent downturn, the upside potential of the USD JPY is still seriously capped however. Specifically, strongly bearish 12 and 20 day EMA’s will give pause for thought as the pair pushes higher. In addition, the 100 day EMA will be a strong source of dynamic resistance if the pair has actually turned bullish.
Ultimately, more time is needed to confirm any trends with this particular pair. However, divergence will likely remain a key indicator to keep an eye on as the last large tumble was preceded by relatively strong divergence signals. Additionally, it’sworth noting that the daily EMA’s remain heavily bearish which should bring into question any claims of a long-term trend reversal.

