Beauty products and fragrance maker Coty (NYSE:COTY) stock is finally reversing the monthly downtrend that started in 2020 and further accelerated by the pandemic. The fragrance industry was one of the hardest hit industries as consumers work, learn, and entertain at home.
As the vaccine rollout continues to accelerate, a return to (the new) normal will improve the prospects for Coty. This is a turnaround situation backed by insiders with plenty of skin in the game as the Company is managing to trim its long-term debt by 40% in 2021 as sales stabilize. Shares are still trading well below pre-COVID levels presenting prudent investors opportunistic pullback levels from its recent earnings sell-off.
Q2 Fiscal 2021 Earnings Release
On Feb. 9, 2021, Coty released its fiscal second-quarter 2021 results for the quarter ending December 2020. The Company reported an adjusted earnings-per-share (EPS) profit of $0.12 excluding non-recurring items versus consensus analyst estimates for a profit of $0.08, beating estimates by $0.04. Revenues fell (-15.9%) year-over-year (YOY) to $1.42 billion, falling short of analyst estimates for $1.44 billion. The Company’s anticipates fixed cost decrease of approximately $300 million to contribute an expected adjusted EBITDA of $750 million for fiscal 2021. Net debt will also fall below $5 billion as the Company seeks to drive leverage ration towards 5X by end of current year 2021. The Company generated $390 million in free cash flow.
Conference Call Takeaways
Coty CEO, Sue Nabi, set the tone:
“Our Q2 profit and net debt came in well ahead of expectations… our adjusted operating income and EBITDA grew high single digits versus last year as we continued executing on our cost reduction program with approximately $80 million of savings delivered in the quarter…the successful closing of the Wella transaction and strong free cash flow drove our financial debt down to $4.8 billion with an economic net debt of $3.6 billion when taking into account the value of our retained Wella stake.”
The Wella deal with private equity firm KKR (NYSE:KKR) injected $2.5 billion of cash for a 60% stake of Wella through a convertible preferred stock deal with a 9% coupon and conversion price of $6.28 per share. This makes KKR is a 17% owner of Coty with the largest holder is private equity firm JAB with a 50% stake averaged at $11 per share. The Company saw e-commerce sales grow 40% YoY with 19% penetration. The Americas provided over 50% online revenue growth followed by 30% in Europe, with 45% growth in prestige products and 20% growth in mass products. E-commerce powerhouses include Hugo Boss in prestige and Rimmel in mass.
Brand Strategies
The Company collaborated with Amazon (NASDAQ:AMZN) Global Vendor Management Program to share data, improve service levels and trial new programs. For example, the Vendor Flex program setup an Amazon fulfillment operation inside a U.K. Coty warehouse cutting down delivery times from seven to three days.
Bottom line, Coty doubled its market share of Amazon’s mass beauty business, notably Cover Girl. The TikTok campaign for Marc Jacobs Perfect fragrance and CoverGirl Clean Fresh make-up each garnered over 10 billion views primarily to younger audiences. The Company is also expanding its footprint in China driven by Gucci and Burberry brands in the prestige segment, “both of which are highly desired by Chinese consumers.” Hugo Boss Alive is ranked #1 in Germany and has driven 30% growth in female fragrance in the U.K.
Evercore ISI Upgrade
On Feb. 10, 2021, Evercore ISI upgraded shares of Coty to Outperform from In-Line with a $10 price target. Analyst Robert Ottenstein cited many bullish factors including e-commerce growth of 40%, solid China strategy, cost costing efficiencies, Cover Girl brand turnaround, and growth of the fragrance segment with improving economies.

COTY Opportunistic Pullback Levels
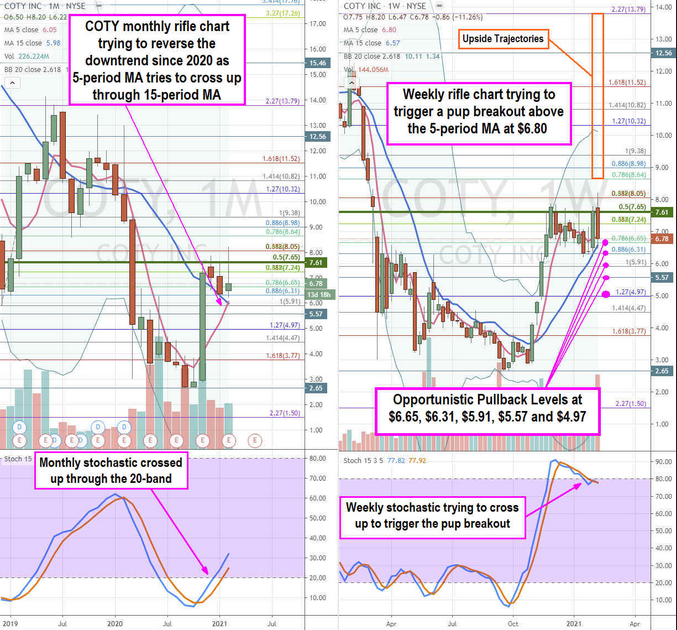
Using the rifle charts on the monthly and weekly time frames provides a broader view of the landscape for COTY stock. The monthly rifle chart is trying to reverse the downtrend that started heading into 2020 as shares collapsed from the $11.52 Fibonacci (fib) level. The monthly stochastic crossed up through the 20-band indicating the buying momentum as the monthly 5-period moving average (MA) at $6.05 tries to cross up through the 15-period MA at $5.98.
The monthly market structure low (MSL) buy triggers above $7.61. The weekly rifle chart has a stalled uptrend with the 5-period MA at $6.80 as the stochastic attempts to cross back up to trigger a pup breakout. If the weekly stochastic can’t cross back up as the stock breaks out through the 5-period MA, then it may form a mini inverse pup which can present opportunistic pullback levels at the $6.65 fib, $6.31 fib, $5.91 fib, $5.57 sticky 5s and the $4.97 fib. The upside trajectories range from the $8.64 fib upwards to the $13.79 fib.
