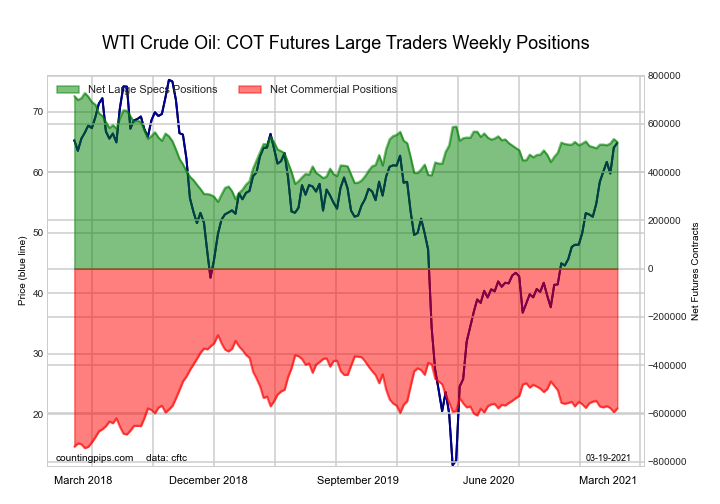
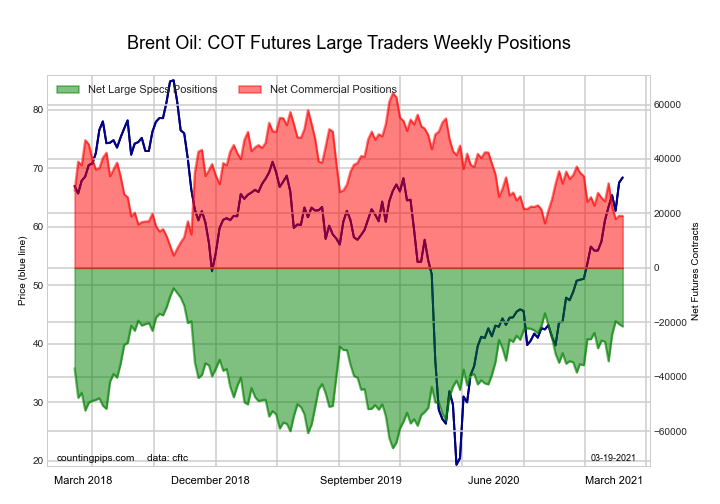
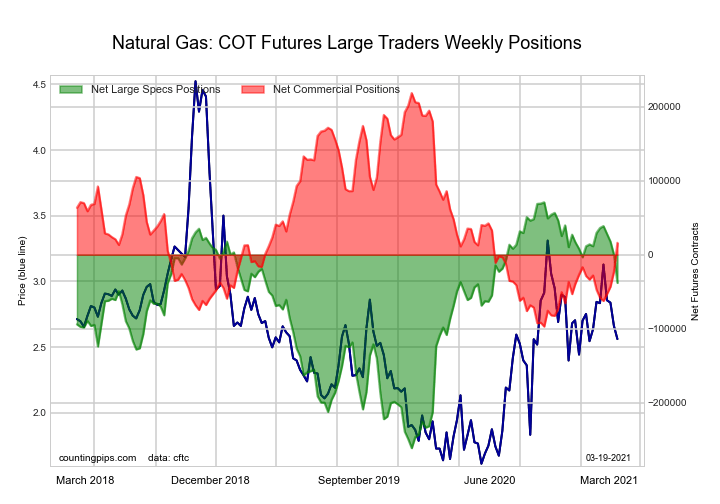
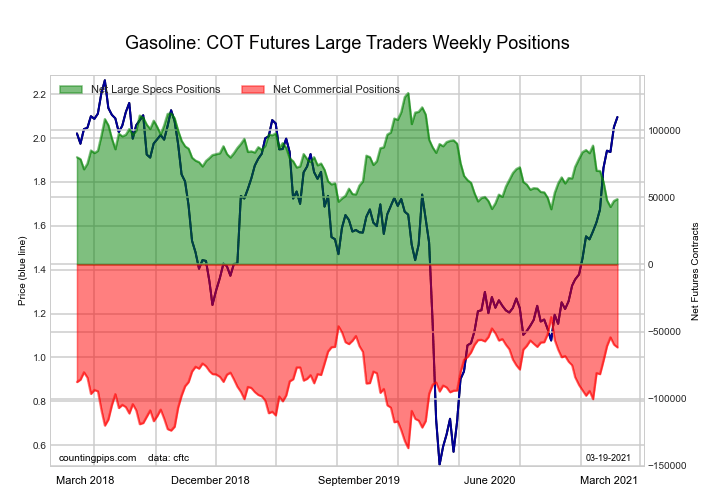
Here are the latest charts and statistics for the Commitment of Traders (COT) data published by the Commodities Futures Trading Commission (CFTC).
The latest COT data is updated through Tuesday March 16 2021 and shows a quick view of how large traders (for-profit speculators and commercial entities) were positioned in the futures markets.
WTI Crude Oil Futures:
| WTI Crude Oil Futures Statistics | SPECULATORS | COMMERCIALS | SMALL TRADERS |
| – Percent of Open Interest Longs: | 27.0 | 32.7 | 4.3 |
| – Percent of Open Interest Shorts: | 6.1 | 55.7 | 2.2 |
| – Net Position: | 525,442 | -579,200 | 53,758 |
| – Gross Longs: | 680,508 | 825,944 | 108,284 |
| – Gross Shorts: | 155,066 | 1,405,144 | 54,526 |
| – Long to Short Ratio: | 4.4 to 1 | 0.6 to 1 | 2.0 to 1 |
| NET POSITION TREND: | |||
| – COT Index Score (3 Year Range Pct): | 55.0 | 35.2 | 91.1 |
| – COT Index Reading (3 Year Range): | Bullish | Bearish | Bullish-Extreme |
| NET POSITION MOVEMENT INDEX: | |||
| – 6-Week Change in Strength Index: | 5.8 | -6.6 | 6.7 |
Brent Crude Oil Futures (LAST DAY):
| Brent Crude Oil Futures Statistics | SPECULATORS | COMMERCIALS | SMALL TRADERS |
| – Percent of Open Interest Longs: | 18.5 | 43.7 | 3.5 |
| – Percent of Open Interest Shorts: | 28.5 | 34.9 | 2.4 |
| – Net Position: | -21,517 | 19,074 | 2,443 |
| – Gross Longs: | 39,928 | 94,191 | 7,511 |
| – Gross Shorts: | 61,445 | 75,117 | 5,068 |
| – Long to Short Ratio: | 0.6 to 1 | 1.3 to 1 | 1.5 to 1 |
| NET POSITION TREND: | |||
| – COT Index Score (3 Year Range Pct): | 76.0 | 24.4 | 39.6 |
| – COT Index Reading (3 Year Range): | Bullish | Bearish | Bearish |
| NET POSITION MOVEMENT INDEX: | |||
| – 6-Week Change in Strength Index: | 8.8 | -11.1 | 9.0 |
Natural Gas Futures (CME):
| Natural Gas Futures Statistics | SPECULATORS | COMMERCIALS | SMALL TRADERS |
| – Percent of Open Interest Longs: | 21.3 | 43.6 | 4.9 |
| – Percent of Open Interest Shorts: | 24.4 | 42.2 | 3.1 |
| – Net Position: | -38,022 | 16,143 | 21,879 |
| – Gross Longs: | 257,397 | 527,092 | 58,828 |
| – Gross Shorts: | 295,419 | 510,949 | 36,949 |
| – Long to Short Ratio: | 0.9 to 1 | 1.0 to 1 | 1.6 to 1 |
| NET POSITION TREND: | |||
| – COT Index Score (3 Year Range Pct): | 67.2 | 35.8 | 17.4 |
| – COT Index Reading (3 Year Range): | Bullish | Bearish | Bearish-Extreme |
| NET POSITION MOVEMENT INDEX: | |||
| – 6-Week Change in Strength Index: | -20.3 | 20.1 | 13.0 |
Gasoline Futures:
| Nasdaq Mini Futures Statistics | SPECULATORS | COMMERCIALS | SMALL TRADERS |
| – Percent of Open Interest Longs: | 27.4 | 48.2 | 6.6 |
| – Percent of Open Interest Shorts: | 15.8 | 62.8 | 3.4 |
| – Net Position: | 48,695 | -61,800 | 13,105 |
| – Gross Longs: | 115,076 | 202,573 | 27,568 |
| – Gross Shorts: | 66,381 | 264,373 | 14,463 |
| – Long to Short Ratio: | 1.7 to 1 | 0.8 to 1 | 1.9 to 1 |
| NET POSITION TREND: | |||
| – COT Index Score (3 Year Range Pct): | 8.7 | 76.9 | 89.9 |
| – COT Index Reading (3 Year Range): | Bearish-Extreme | Bullish | Bullish-Extreme |
| NET POSITION MOVEMENT INDEX: | |||
| – 6-Week Change in Strength Index: | -24.4 | 19.6 | 11.9 |
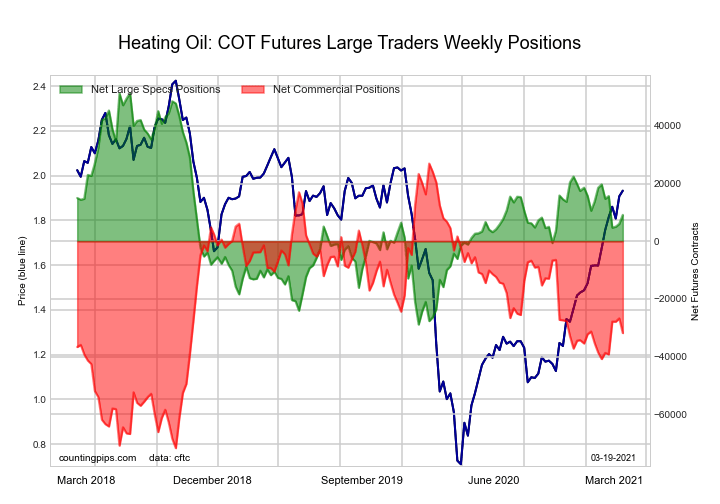
#2 Heating Oil NY-Harbor Futures:
| Heating Oil Futures Statistics | SPECULATORS | COMMERCIALS | SMALL TRADERS |
| – Percent of Open Interest Longs: | 15.0 | 51.7 | 10.5 |
| – Percent of Open Interest Shorts: | 13.0 | 58.6 | 5.6 |
| – Net Position: | 9,136 | -31,801 | 22,665 |
| – Gross Longs: | 68,969 | 237,586 | 48,456 |
| – Gross Shorts: | 59,833 | 269,387 | 25,791 |
| – Long to Short Ratio: | 1.2 to 1 | 0.9 to 1 | 1.9 to 1 |
| NET POSITION TREND: | |||
| – COT Index Score (3 Year Range Pct): | 47.3 | 40.4 | 91.0 |
| – COT Index Reading (3 Year Range): | Bearish | Bearish | Bullish-Extreme |
| NET POSITION MOVEMENT INDEX: | |||
| – 6-Week Change in Strength Index: | -13.2 | 9.1 | 6.4 |
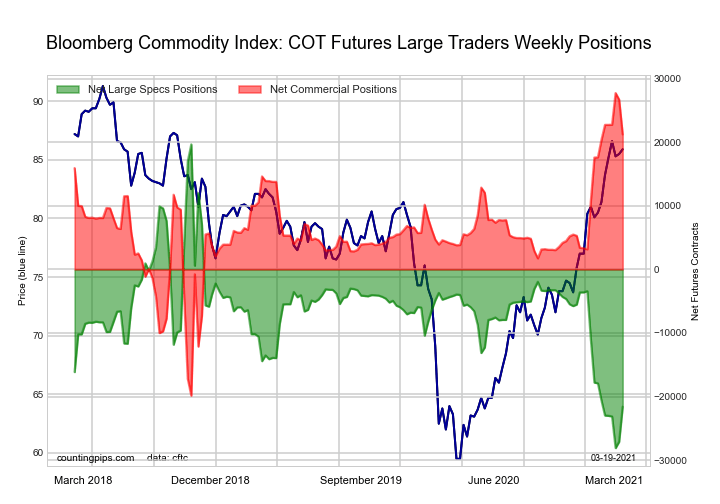
Bloomberg Commodity Index Futures:
| Bloomberg Index Futures Statistics | SPECULATORS | COMMERCIALS | SMALL TRADERS |
| – Percent of Open Interest Longs: | 42.4 | 43.1 | 0.7 |
| – Percent of Open Interest Shorts: | 78.9 | 7.1 | 0.1 |
| – Net Position: | -21,600 | 21,238 | 362 |
| – Gross Longs: | 25,037 | 25,455 | 424 |
| – Gross Shorts: | 46,637 | 4,217 | 62 |
| – Long to Short Ratio: | 0.5 to 1 | 6.0 to 1 | 6.8 to 1 |
| NET POSITION TREND: | |||
| – COT Index Score (3 Year Range Pct): | 13.6 | 86.3 | 68.8 |
| – COT Index Reading (3 Year Range): | Bearish-Extreme | Bullish-Extreme | Bullish |
| NET POSITION MOVEMENT INDEX: | |||
| – 6-Week Change in Strength Index: | -2.1 | 1.8 | 9.7 |

