


Sign up to create alerts for Instruments,
Economic Events and content by followed authors
Free Sign Up Already have an account? Sign In
Please try another search

Cosan Limited (NYSE:CZZ) recently reported impressive results for 2017. Its adjusted net income was R$188.2 million ($59 million), reflecting an improvement over the net loss of R$135.3 million ($38.8 million) in 2016. The company’s share price has grown roughly 1.23% since the results were announced on Mar 1.
However, fourth-quarter results were disappointing with the adjusted net loss of R$203.3 million ($63.7 million). In the year-ago quarter, the company recorded net income of R$3.6 million ($1.1 million).
Revenues Improve Y/Y
In the quarter, Cosan’s net revenues were R$3,717.2 million ($1,143.8 million), increasing 33.4% year over year.
The company operates in two business segments: Cosan S.A. and Cosan Logistica S.A. While Cosan S.A includes Raizen Energia, Raizen Combustiveis, Comgas, Moove and Cosan Corporate; Cosan Logistica comprises the Rumo Logistica business.
Fuel volumes sold increased 4.3% year over year on the back of 34.3% growth in ethanol volumes sold, 9.4% rise in diesel volume and 3.1% increase in aviation fuel volumes. However, this was partially offset by 8.3% fall in gasoline volumes.
Sugar volume sold increased 2.1% year over year to 1.1 million tons. Of the total, roughly 70.4% was exported while the rest was sold domestically. Ethanol volume sold was roughly flat at 1 million cbm, including 29.8% of export volume and the rest of domestic volume.
Total natural gas sales volume grew 4% year over year while lubricants sales volume was flat. For Rumo, total volume transported increased 79% year over year.
For 2017, the company’s net revenues grew 8.5% year over year to $13,582.5 million ($4,257.8 million).
Gross Margin Improves
Cosan’s margin profile improved in the fourth quarter. Its cost of sales and services sold grew 20.1% year over year to R$2,665 million ($820 million) and represented 71.7% of net revenues, down from 79.7% in the year-ago quarter. Gross margin increased 800 basis points year over year to 28.3%.
Selling, general and administrative expenses grew 6.3% year over year to R$583.4 million ($179.5 million), representing 15.7% of net revenues. Financial expenses were R$925.8 million ($284.9 million), up 28.9% year over year.
Balance Sheet & Capital Expenditure
Exiting the fourth quarter, Cosan had cash and cash equivalents of R$4,555 million ($1,376.1 million), down from R$5,802 million ($1,836.1 million) at previous quarter-end. Loans and borrowings increased 1.7% sequentially to R$21,689 million ($6,552.6 million).
In the quarter, the company’s capital expenditure totaled R$910.7 million ($280.2 million), reflecting the growth of 51.8% over the year-ago quarter.
Outlook
For 2018, Cosan anticipates pro forma net revenues to be R$50-R$53 billion for Cosan S.A. Earnings before interest, tax, depreciation and amortization (EBITDA) are projected to be within R$4.9-R$5.4 billion. Guidance for Cosan S.A.’s and Rumo’s businesses is discussed below:
Raizen Energia (guidance for crop year April 2018-March 2019): Management expects crushed sugarcane volumes to be 63-67 million tons. Sugar volume produced is likely to come in a range of 4.2-4.6 million tons.
Ethanol volume production is expected to be in the range of 2.3-2.6 billion liters while the volume of energy sold is expected within 2.5-2.7 million MWh. EBITDA is likely to come within R$3.4-R$3.8 billion while capital spending is anticipated within R$2.4-R$2.7 billion.
Raizen Combustiveis: EBITDA is predicted in a range of R$2.85-R$3.15 billion and capital expenditure is likely to be within R$800-R$1,000 million.
Moove: EBITDA is expected in the range of R$200-R$230 million.
Comgas: Volume of gas sold is likely to fall within 4.4-4.6 million cbm while EBITDA is projected in a range of R$1.77-R$1.87 billion. Capital expenditure is likely to be in the range of R$450-R$500 million.
Rumo: EBITDA is predicted in a range of R$3.05-R$3.25 billion and capital expenditure is expected within R$1.9-R$2.1 billion.
Cosan Limited Price and Consensus
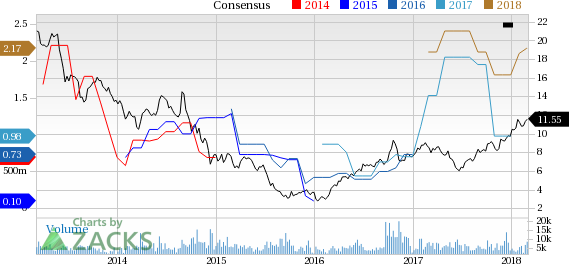
Cosan Limited Price and Consensus | Cosan Limited Quote
Zacks Rank & Other Stocks to Consider
With a market capitalization of approximately $3.1 billion, Cosan presently sports a Zacks Rank #1 (Strong Buy). Other stocks worth considering in the Zacks Basic Materials sector include Cal-Maine Foods, Inc. (NASDAQ:CALM) , The Andersons, Inc. (NASDAQ:ANDE) , and CF Industries Holdings, Inc. (NYSE:CF) . All these stocks sport a Zacks Rank #1. You can see the complete list of today’s Zacks #1 Rank stocks here.
Cal-Maine Foods’ earnings estimates for fiscal 2018 (ending May 2018) and fiscal 2019 (ending May 2019) have improved over the past 60 days. Also, the company pulled off a positive earnings surprise of 10% in the last quarter.
The Andersons’ earnings estimates for 2018 have been revised upward over the last 60 days. Also, the company delivered a positive earnings surprise of 63.16% in the last quarter.
CF Industries Holdings’ earnings estimates for 2018 and 2019 have improved over the past 60 days. Average earnings surprise for the last four quarters has been a positive 72.87%.
The Hottest Tech Mega-Trend of All
Last year, it generated $8 billion in global revenues. By 2020, it's predicted to blast through the roof to $47 billion. Famed investor Mark Cuban says it will produce "the world's first trillionaires," but that should still leave plenty of money for regular investors who make the right trades early.
See Zacks' 3 Best Stocks to Play This Trend >>
Shares of Caesars Entertainment (NASDAQ:CZR), a leading gambling stock, traded around 3% higher on Wednesday morning, though the stock was trading around 1.5% lower shortly before...
Amazon (NASDAQ:AMZN) is making a significant push into the future with a robust investment in robotics and artificial intelligence. The company has earmarked $35 billion for...
Home Depot’s (NYSE:HD) Q4 2024 report and guidance for 2025 have plenty to be unhappy about, but the simple truth is that this company turned a corner in 2024. It is on track for...
Are you sure you want to block %USER_NAME%?
By doing so, you and %USER_NAME% will not be able to see any of each other's Investing.com's posts.
%USER_NAME% was successfully added to your Block List
Since you’ve just unblocked this person, you must wait 48 hours before renewing the block.
I feel that this comment is:
Thank You!
Your report has been sent to our moderators for review
Add a Comment
We encourage you to use comments to engage with other users, share your perspective and ask questions of authors and each other. However, in order to maintain the high level of discourse we’ve all come to value and expect, please keep the following criteria in mind:
Enrich the conversation, don’t trash it.
Stay focused and on track. Only post material that’s relevant to the topic being discussed.
Be respectful. Even negative opinions can be framed positively and diplomatically. Avoid profanity, slander or personal attacks directed at an author or another user. Racism, sexism and other forms of discrimination will not be tolerated.
Perpetrators of spam or abuse will be deleted from the site and prohibited from future registration at Investing.com’s discretion.