👀 Ones to watch: Undervalued stocks to buy before they report Q3 earningsSee Undervalued Stocks

Correlation Between USD/JPY And S&P 500

Published 08/22/2019, 12:33 AM
USD/JPY
-

Just from looking at a chart of the price action, one can see that the USD/JPY and the S&P 500 are strongly correlated. As you can see from the 240-minute chart below, the 2 instruments generally move together:
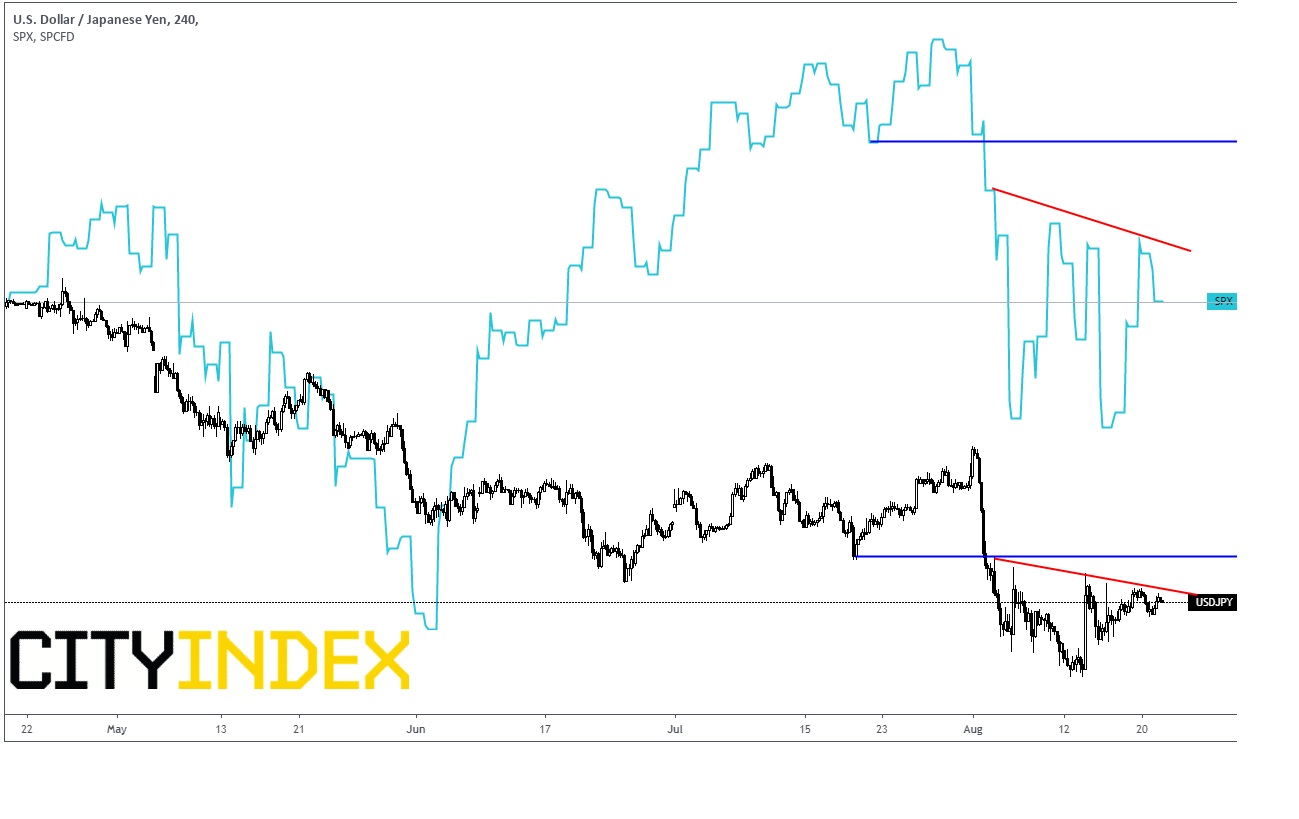
USD/JPY Chart

When stocks sell off, USD/JPY tends to sell off as well. The reverse is also true: As stocks go bid, USD/JPY tends to go bid as well. The reason is that the Yen is considered to be an extremely safe asset.

We have some important events occurring over the next few days, which may add some volatility to the 2 instruments:

Today: July FOMC meeting minutes

Thursday: PMI manufacturing data

Friday: Fed Chairman Powell speaks at Jackson Hole

If the S&P 500 takes out the Trendline resistance at 2933, there is room to move up to horizontal resistance near 2965.
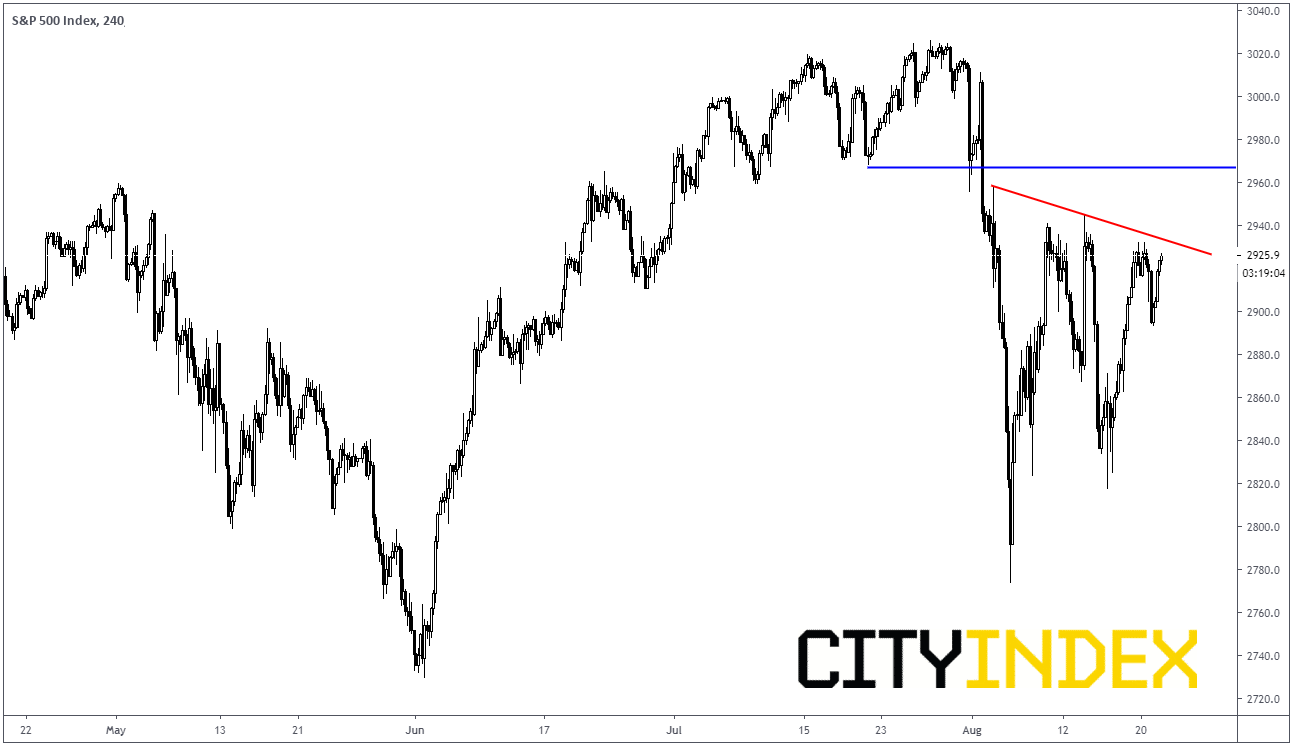
S&P 500 Index

If that happens, keep an eye on USD/JPY. If the currency pair continues to move with the S&P 500, USD/JPY could take out the trendline at 106.42 and there will be room to run up to horizontal resistance near 107.25.

If you are looking to trade USD/JPY, you may want to watch the S&P 500!

Original Post

Latest comments

Loading next article…
Risk Disclosure: Trading in financial instruments and/or cryptocurrencies involves high risks including the risk of losing some, or all, of your investment amount, and may not be suitable for all investors. Prices of cryptocurrencies are extremely volatile and may be affected by external factors such as financial, regulatory or political events. Trading on margin increases the financial risks.
Before deciding to trade in financial instrument or cryptocurrencies you should be fully informed of the risks and costs associated with trading the financial markets, carefully consider your investment objectives, level of experience, and risk appetite, and seek professional advice where needed.
Fusion Media would like to remind you that the data contained in this website is not necessarily real-time nor accurate. The data and prices on the website are not necessarily provided by any market or exchange, but may be provided by market makers, and so prices may not be accurate and may differ from the actual price at any given market, meaning prices are indicative and not appropriate for trading purposes. Fusion Media and any provider of the data contained in this website will not accept liability for any loss or damage as a result of your trading, or your reliance on the information contained within this website.
It is prohibited to use, store, reproduce, display, modify, transmit or distribute the data contained in this website without the explicit prior written permission of Fusion Media and/or the data provider. All intellectual property rights are reserved by the providers and/or the exchange providing the data contained in this website.
Fusion Media may be compensated by the advertisers that appear on the website, based on your interaction with the advertisements or advertisers.
© 2007-2024 - Fusion Media Limited. All Rights Reserved.