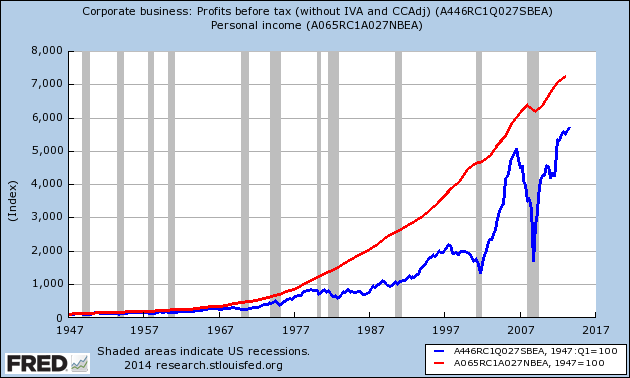
There have been several posts recently in cyberspace talking about the disproportionate growth of corporate earnings to the earnings of our Joe Sixpack.
The graph below is indexed to the first date that the BEA produced a common data set for both corporate profits and personal income.

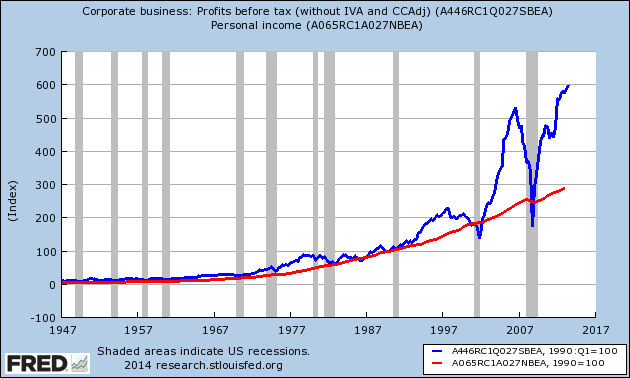
If one takes the index and moves it to January 1990, the data has a different feel.

I have written extensively that something(s) changed in the economy around 2000 causing much slower economic growth and a real decline in employment levels. The blame could be placed on:
Free Trade Agreements – Free trade likely caused much of the employment difficulties since 2000, although I doubt this factor is in play anymore as dynamics have changed to favor U.S. domestic vs. foreign production.
Non-Productive Income from Money -Many pundits spout about productivity without realizing that productivity is hard to measure. Productivity is a time-and-motion tool originally designed to measure man-hours against output. Once modern day economists started to utilize this tool using monetary factors (as they could not spend the time to really measure the time-and-motion elements) – this tool became corrupted. Further, control (the relative correlation over time) was lost when they tried to factor outsourcing (including several other issues listed below) using monetary measures. Income or spending is not appropriate for measuring productivity – they are related to profit measurement.
Table 1 – Sector Breakdown of Income Growth between 1Q2001 and 3Q2013 (extracted from BEA Table 6.1D. National Income Without Capital Consumption Adjustment by Industry)
| Sector | Percent Real Income Growth 1Q2001 to 3Q2013 | Contribution to Private Industry Income Growth |
| Private industries | 39% | 100.0% |
| Agriculture, forestry, fishing, and hunting | 173% | 3.2% |
| Mining | 100% | 3.1% |
| Utilities | 27% | 1.7% |
| Construction | -4% | 2.8% |
| Manufacturing | 4% | 8.5% |
| Durable goods | 0% | 4.5% |
| Nondurable goods | 10% | 4.1% |
| Wholesale trade | 28% | 6.9% |
| Retail trade | 14% | 6.5% |
| Transportation and warehousing | 30% | 3.5% |
| Information | 31% | 4.0% |
| Finance, insurance, real estate, rental, and leasing | 25% | 18.9% |
| Professional and business services | 45% | 18.2% |
| Educational services, health care, and social assistance | 67% | 15.0% |
| Arts, entertainment, recreation, accommodation, and food services | 67% | 4.9% |
| Other services, except government | 22% | 3.0% |
| Government | 24% |
One measure of productive use of money would be the number of people employed by the various sectors (table 2 below) – and compare the results with the growth of profits in table 1 above:
Table 2 – Employment Growth by Sector
| 1Q2001 Percent of Employment | 4Q2013 Percent of Employment | Percent employment growth from 1Q2001 to 4Q2014 | |
| Finance and Insurance | 4.7% | 4.6% | 1.7% |
| Agriculture | 1.9% | 1.7% | -5.6% |
| Construction | 5.9% | 5.6% | -4.1% |
| Manufacturing | 13.7% | 9.4% | -29.7% |
| Transportation & Utilities | 21.1% | 20.6% | 0.1% |
| Agriculture | 1.9% | 1.7% | -5.6% |
| Retail Trade | 12.4% | 12.1% | 0.0% |
| Information Services | 3.0% | 2.1% | -28.0% |
| Professional & Business Service | 13.5% | 14.7% | 11.7% |
| Education & Health Services | 12.3% | 16.3% | 35.6% |
| Leisure & Hospitality | 9.6% | 11.2% | 19.3% |
If employment gains were the measure of productive use of money, the winners are:
- leisure & hospitality
- education and health
There is no arguing that education is an investment in the future of the economy by providing an educated workforce. But health care has both positive and negative economic implications. Leisure and hospitality has little future economic benefit – it is mostly related to instant gratification.
What is economically productive use of money, and how does one measure productive use of money?
This week productivity for the 4Q2013 was released showing a quarter-over-quarter growth of 3.2% for non-farm business. The fallacy here is that productivity is NOT being measured properly. Most assume that if a business makes the same amount of money using fewer people it is a PRODUCTIVITY improvement. Described correctly, what is going on is that employment is becoming a smaller component in corporate outlays. The reasons fewer people are needed may be due to elements unrelated to labor productivity such as:
- outsourcing [note that the BLS tries to adjust for this but is admittedly not successful];
- changes to the product (e,g. no customer service or selling warranties as a separate profit center) to make it less labor intensive (try contacting a person at Yahoo or Facebook for assistance);
- closing or discontinuing products or services or marketplaces (usually caused by cutting operations with lower profit margins);
- cutting back on plant maintenance or investments – or reducing overhead functions in an organization (such as human resources, benefits, company transport);
- producing an entirely new product which replaces an existing product (internet streaming vs. broadcast TV).
Many pundits attribute this seemingly lower pay and lower employment to corporate greed. A corporation is bound by its mission to maximize the bottom line.* I don’t call this greed but it is an argument over semantics as the end result is the same.
*Of course we could get into the difference between maximizing the bottom line for a quarter rather than a multi-year business cycle. But that is a discussion to be left for another day.
In Economics 101, we learned that there are winners and losers with productivity gains. But in the end, productivity gains historically are a positive economic dynamic. Many are now saying that the current productivity improvements have not resulted in the historical correlation (improvement) to labor rates. The foundation of this comparison is sound since history has shown it to be true for significant periods of time. I believe that any economic theory is true until it is no longer true. All economic theories are generalizations and the exceptions (or parameters) of these theories are unknown until they are tested. Add my argument that we are no longer measuring “real” productivity – and one can begin to understand that trying to correlate productivity and wages may be a fools mission.
Few are understanding that automation (one of the elements of productivity measurement) has passed the tipping point where the automation job gains are not overcoming the job losses caused by automation. We are making machines and computers more durable – they require less maintenance, and fewer and fewer people to build. That could well mean that the labor intensive service sector is ripe to the type of labor saving automation seen in manufacturing.
We may now experience a productivity improvement in services that doesn’t see a corresponding increase in production but results in a diminishing of the labor share of services – and from that a decline in relative aggregate demand.
Will we continue to optimize by the quarter and not assess the longer-term impacts?
This entire situation brings to mind Skynet. One might say that Skynet is active. Judgment Day has passed. But like boiling frogs slowly in water – the humans are not understanding what is going on, and believing the enemy is corporations or government or whatever. There are likely defenses against Skynet – but they cannot be discovered if no one sees the problem.
Other Economic News this Week:
The Econintersect economic forecast for February 2014 continues to confirm a moderately improving economy without the roller coaster effect seen from the end of the Great Recession to mid 2013. Is this suggesting 2014 will be a good year? – This remains to be seen.
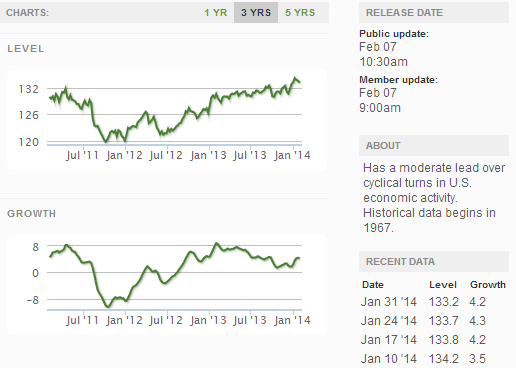
The ECRI WLI growth index value has been weakly in positive territory for over four months – but in a noticeable improvement trend. The index is indicating the economy six months from today will be slightly better than it is today.
Current ECRI WLI Growth Index
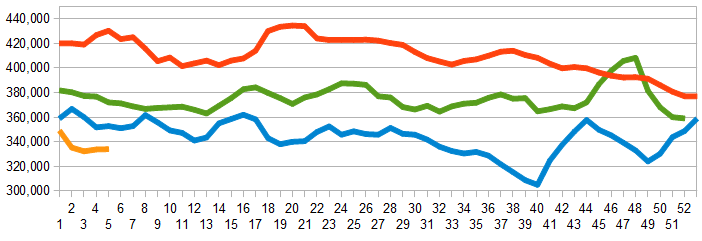
Initial unemployment claims went from 348,000 (reported last week) to 331,000 this week. Historically, claims exceeding 400,000 per week usually occur when employment gains are less than the workforce growth, resulting in an increasing unemployment rate. The real gauge – the 4 week moving average – marginally worsened from 333,000 (reported last week) to 334,000. Because of the noise (week-to-week movements from abnormal events AND the backward revisions to previous weeks releases), the 4-week average remains the reliable gauge.
Weekly Initial Unemployment Claims – 4 Week Average – Seasonally Adjusted – 2011 (red line), 2012 (green line), 2013 (blue line), 2014 (orange line)
Bankruptcies this Week: Hibu (Chapter 15), Tuscany International Holdings, Buffet Partners
Click here to view the scorecard table below with active hyperlinks
Weekly Economic Release Scorecard:


