The recent economic reports show that the current coronavirus crisis will be bigger than the Great Recession. What does it imply for the gold market?
US Economic Data Paints a Gloomy Picture
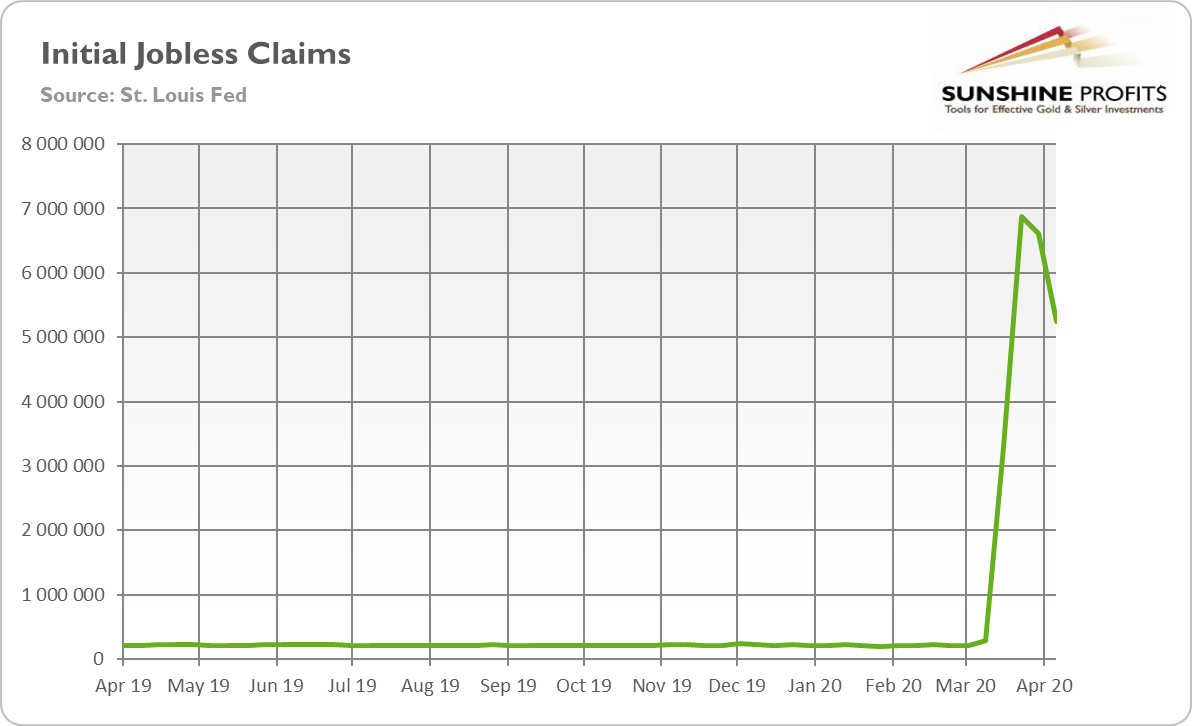
This week was full of new reports about the US economy. And guess what, I don’t have good news… First of all, let’s start with an update about the weekly initial unemployment benefits. In normal times, the initial claims are not too keenly watched by investors. But in times of a pandemic, they are very informative. The spike in the initial claims may even become the symbol of this crisis. Anyway, the number of new claims for the unemployment benefits declined from 6.6 million in the previous week to 5.2 million in the week from April 4 to April 11, as the chart below shows.
Chart 1: Initial jobless claims from April 2019 to April 2020

That’s good that the number is not accelerating, but, hey, more than 5 million of Americans applied for unemployment benefit in just one week, about 25 times more than before the epidemic! And do you know what is even crazier? The monthly figure. In just the past four weeks, 22 million people went unemployed.
Now, I have two questions for you. First, how many Americans were in unemployment in February, before the outbreak of epidemic? I’ll tell you: 5.8 million. So, in just one month we almost quadrupled this number. Second, do you know what is the implied unemployment rate? Well, when we add 22 to 5.8 million, and subtract the exact number from the pool of employed number, we will get 20.3 percent. Yup, more than 20 percent. So it is already higher than during the Great Recession and almost as high as during the Great Depression! Of course, our estimates may overestimate the unemployment rate as some people rather dropped out from the labor force, but still, the situation in the US labor market has become unbelievably grim in an unprecedentedly short time.
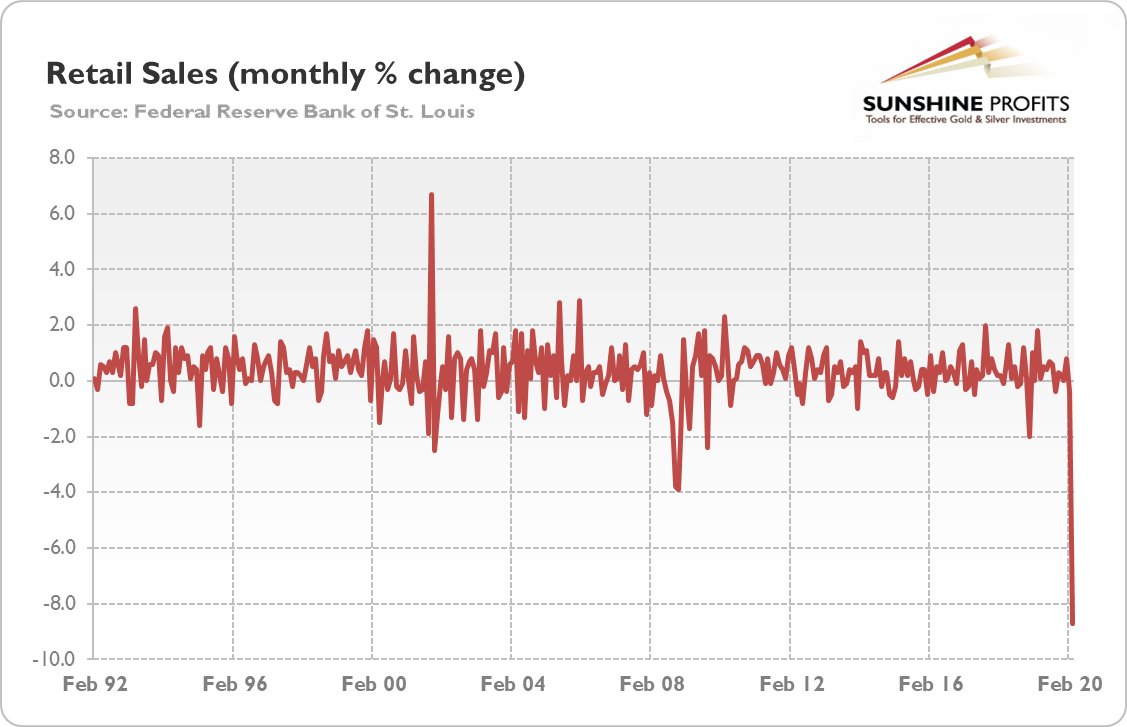
Second, retail sales plunged a record 8.7 percent in March compared to the previous month, as one can see in the chart below. The decline was more than double the biggest one-month drop during the global financial crisis. Importantly, given that the lockdown began only in mid-March and initially sparked a panic buying of necessities, April will be much worse.
Chart 2: US retail sales (% monthly change) from February 1992 to March 2020

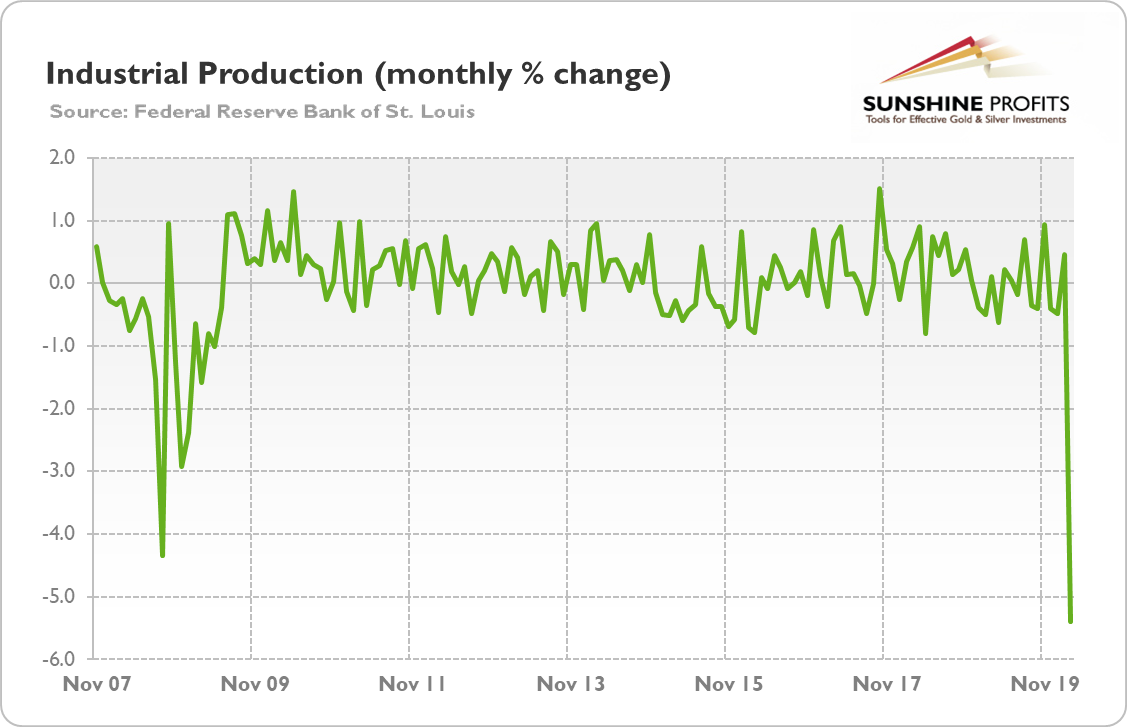
Third, the industrial production plunged 5.4 percent in March, as the pandemic led many factories to suspend operations late in the month. As the chart below shows, it was a bigger decline than during the Great Recession. Actually, it was the biggest drop since early 1946. Moreover, capacity utilization for the industrial sector decreased by 4.3 percentage points to 72.7 percent in March, the lowest level since the Great Recession. Again, the worse is yet to come in April.
Chart 3: Industrial production index (monthly % change) from November 2007 to March 2020.

Fourth, the recent readings of the regional manufacturing indices for April also reveal the deep economic crisis. For example, the New York Federal Reserve’s Empire State business conditions index plunged from -21.5 to the -78.2 in April, the lowest number on record. Meanwhile, the Philadelphia Fed manufacturing index dropped from -12.5 in March to -56.6 in April, the lowest reading since July 1980.
Moreover, the National Association of Home Builders’ monthly confidence index fell from 72 in March to 30 in April, the largest monthly change in the 30-year history of the index. So, it seems that the pandemic is also affecting construction and the real estate market.
Last but not least, the newest Beige Book indicates that economic activity contracted sharply and abruptly across all regions in the United States as a result of the COVID-19 pandemic. Importantly, most business contacts expect conditions to worsen in the next several months.
Implications for Gold
What does it all imply for gold from the fundamental point of view? Well, let’s face it. This economic crisis is very deep, much deeper than the Great Recession. So, if gold rallied to $1,900 in the aftermath of the Lehman Brothers’ bankruptcy, why shouldn’t it rally also now, when the economic calamity is much greater? After all, the real interest rates are lower, while the public debt is higher than a decade ago.
The only reason could be that this crisis, although deep, will turn out to be short-lived. It is, of course, possible, if some genius develops an accepted amazing treatment. I wish the pandemic ended quickly. I wish it could be just a one-and-done crash like in 1987. However, I’m afraid that we will not see a V-shaped recession, nor even a U-shaped depression, but rather a shift into the socially-distanced economy that operates at half capacity for some period of time. And the longer the crisis lasts, the higher chances that other “black swans” will land. Many things may happen: some banks or big companies may go bankrupt, or Italy can default on its bonds, etc. You see, the current financial system based on the fractional reserve banking, fiat money, moral hazard, high debt, low-interest rates, is very fragile, so I bet that the risk aversion will remain high. Anyway, the interest rates should remain at ultra-low levels. So, there are decent chances that we will see higher prices of safe-haven assets such as gold later this year.
Disclaimer: Please note that the aim of the above analysis is to discuss the likely long-term impact of the featured phenomenon on the price of gold and this analysis does not indicate (nor does it aim to do so) whether gold is likely to move higher or lower in the short- or medium term. In order to determine the latter, many additional factors need to be considered (i.e. sentiment, chart patterns, cycles, indicators, ratios, self-similar patterns and more) and we are taking them into account (and discussing the short- and medium-term outlook) in our trading alerts.
