The Corn market is beginning to flash a signal of extraordinary magnitude.
A number of technical/fundamental factors are lining up that could usher in a major price move in Corn. While this move could be in either direction, the odds now strongly favor a decline.
Importantly, short sales have a very precise chart level to trade against. There is a chance that Monday’s high will contain the Corn market for many months.
Let me disect this market point by point.
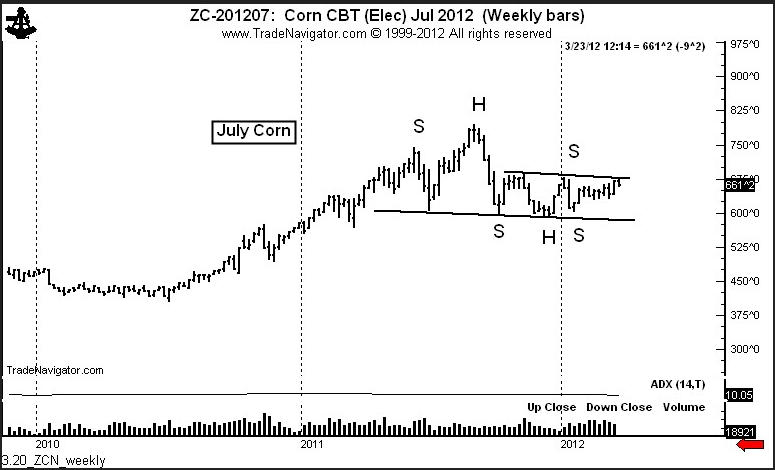
First, the market exhibits a chart construction I call an ”inter-locking H&S” pattern. This is an extremely rare phenomena. As the chart below shows, a 12-month H&S top contains a right shoulder that traces out a H&S bottom formation. Note that the weekly ADX reading is near 10 - a level from which a significant trend is most probable. ADX readings at 10 or below do not last long before a trend begins in earnest.

Interestingly, both the right shoulder of the larger top pattern and the right shoulder of the smaller bottom pattern are extended. I view this extended symmetry as significant - and a sign of a very mature pattern that is ready to launch a move. I may not see another example of this overall chart construction again in my trading career.
Allow me to get on a soup box for a moment. There are a number of self-proclaimed technical “experts” who attack the use of chart patterns at every opportunity. They label patterns incorrectly - and when the incorrectly labeled patterns fail to deliver certain result these experts claim victory in their attack against classical charting principles as a valid means for market speculation. General McAuliffe’s response to the Germans during the Battle of the Bulge is my response to these “experts.”
Classical charting is a craft that must be approached with a level of nuanced sophistication not possessed by its critics. The complex nature of the current Corn market is a perfect example of how the “experts” will make fools of themselves. Markets often provide surprise endings to chart set ups. The really big profits are found in these surprise endings.
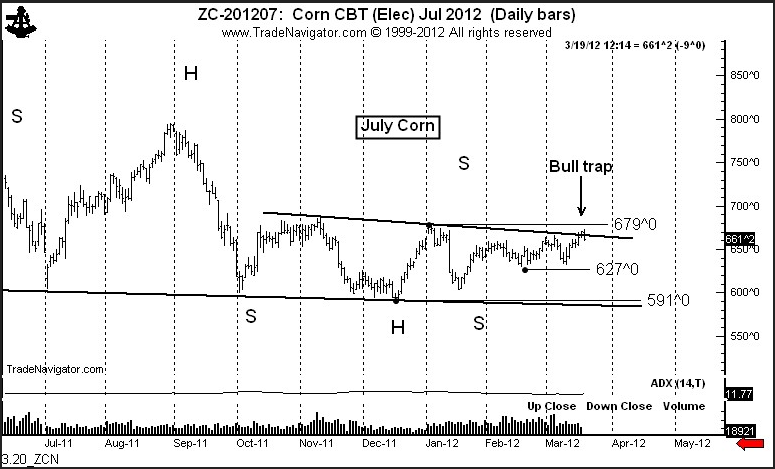
Next, let me drill down on the H&S bottom that has formed since late September. The daily chart below shows this pattern.I often warn chart traders against the use of diagonal (or slanted) boundary lines. Using a finely drawn neckline, the rally on Mar. 16 “completed” the H&S bottom. Yet, I have noted in recent weeks that a close above the January high would be the correct definition of a H&S completion. While a finely drawn neckline was penetrated, the right shoulder high was never violated.

It is quite possible that the sweeping key reversal on Monday is the final nail in a bull trap. I must note that a close above the January high would completely nullify this bearish interpretation. However, a close below the February low would add significant credence to the bearish interpretation. Of course, the completion of the massive H&S top by a close beneath the December low would yield a price target of $3.85 (July contract). This price target is about $2.75 below Monday’s close. The daily ADX recently touched 10 and has turned up. This is sign of a trend about to become fixed. That both the weekly and daily ADX readings are near 10 is a double sign that a big move is pending.
Of course, farmers will scream that $3.85 is not possible because they cannot make money at that price. Since when do the commodity markets really care about the cost of production?
Bottom line is this: The attempt to complete the 6+ month H&S bottom is failing. A line in the sand is visible at the January high. The sweeping reversal on Monday is an indication that:

I believe the final piece to the Corn mosaic comes from the price relationship of Corn to Wheat and Soybeans.Even with the recent strong rally in Soybeans, the old crop Bean/Corn ratio remains at 2.1 to 1 - this is the lower end of the historic range.
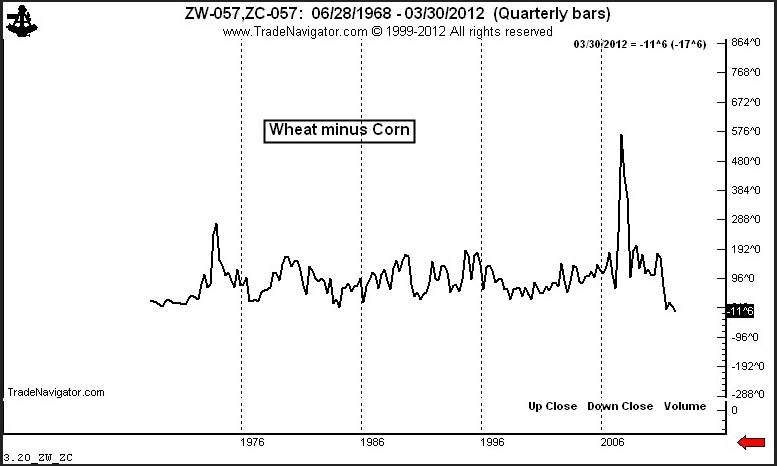
The Wheat/Corn ratio is even more misaligned. The chart below shows the Wheat/Corn spread dating back several decades. Wheat is at an all-time low against Corn. This, all other things being equal, is a bearish factor for Corn.

In summary:
A number of technical/fundamental factors are lining up that could usher in a major price move in Corn. While this move could be in either direction, the odds now strongly favor a decline.
Importantly, short sales have a very precise chart level to trade against. There is a chance that Monday’s high will contain the Corn market for many months.
Let me disect this market point by point.
First, the market exhibits a chart construction I call an ”inter-locking H&S” pattern. This is an extremely rare phenomena. As the chart below shows, a 12-month H&S top contains a right shoulder that traces out a H&S bottom formation. Note that the weekly ADX reading is near 10 - a level from which a significant trend is most probable. ADX readings at 10 or below do not last long before a trend begins in earnest.

Interestingly, both the right shoulder of the larger top pattern and the right shoulder of the smaller bottom pattern are extended. I view this extended symmetry as significant - and a sign of a very mature pattern that is ready to launch a move. I may not see another example of this overall chart construction again in my trading career.
Allow me to get on a soup box for a moment. There are a number of self-proclaimed technical “experts” who attack the use of chart patterns at every opportunity. They label patterns incorrectly - and when the incorrectly labeled patterns fail to deliver certain result these experts claim victory in their attack against classical charting principles as a valid means for market speculation. General McAuliffe’s response to the Germans during the Battle of the Bulge is my response to these “experts.”
Classical charting is a craft that must be approached with a level of nuanced sophistication not possessed by its critics. The complex nature of the current Corn market is a perfect example of how the “experts” will make fools of themselves. Markets often provide surprise endings to chart set ups. The really big profits are found in these surprise endings.
Next, let me drill down on the H&S bottom that has formed since late September. The daily chart below shows this pattern.I often warn chart traders against the use of diagonal (or slanted) boundary lines. Using a finely drawn neckline, the rally on Mar. 16 “completed” the H&S bottom. Yet, I have noted in recent weeks that a close above the January high would be the correct definition of a H&S completion. While a finely drawn neckline was penetrated, the right shoulder high was never violated.

It is quite possible that the sweeping key reversal on Monday is the final nail in a bull trap. I must note that a close above the January high would completely nullify this bearish interpretation. However, a close below the February low would add significant credence to the bearish interpretation. Of course, the completion of the massive H&S top by a close beneath the December low would yield a price target of $3.85 (July contract). This price target is about $2.75 below Monday’s close. The daily ADX recently touched 10 and has turned up. This is sign of a trend about to become fixed. That both the weekly and daily ADX readings are near 10 is a double sign that a big move is pending.
Of course, farmers will scream that $3.85 is not possible because they cannot make money at that price. Since when do the commodity markets really care about the cost of production?
Bottom line is this: The attempt to complete the 6+ month H&S bottom is failing. A line in the sand is visible at the January high. The sweeping reversal on Monday is an indication that:
- The H&S bottom will become a failure sell signal
- The larger H&S top will be completed
- A decline to below $4.00 per bushel is in the air

I believe the final piece to the Corn mosaic comes from the price relationship of Corn to Wheat and Soybeans.Even with the recent strong rally in Soybeans, the old crop Bean/Corn ratio remains at 2.1 to 1 - this is the lower end of the historic range.
The Wheat/Corn ratio is even more misaligned. The chart below shows the Wheat/Corn spread dating back several decades. Wheat is at an all-time low against Corn. This, all other things being equal, is a bearish factor for Corn.

In summary:
- The weekly and daily ADX readings as well as six months of congestion indicate a strong trend could begin at any time. The An explosive upmove cannot be ruled out, but a decisive close above the January high is required to support this conclusion.
- The advance late last week smells like a bull trap. The H&S pattern was completed if a diagonal neckline was drawn, but the January high was not exceeded. Monday’s sweeping reversal supports the thesis of a bull trap.
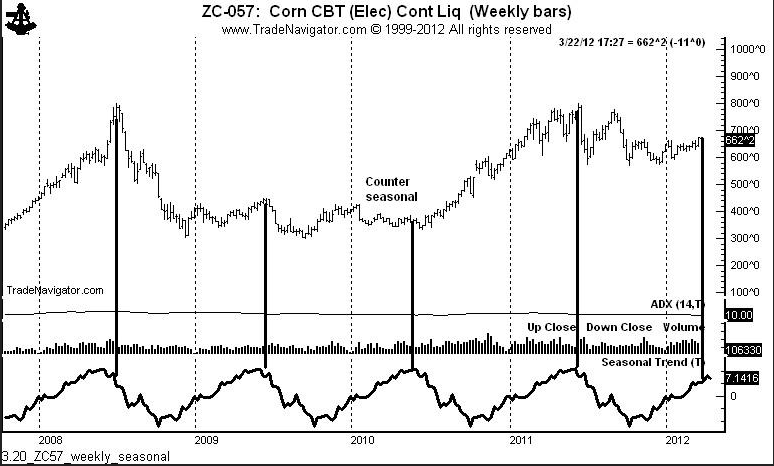
- The price season in Corn is DOWN.
- Corn is way too expenses relative to competing feed grains.
