Those that view the message of the market on a daily basis are likely confused by trading noise. While trading noise contributes to the long-term trends, it does not define them. Human behavior tries to explain trading noise as a meaningful trend. This confuses the majority which, in turn, contributes to their role as bagholders of trend transitions.
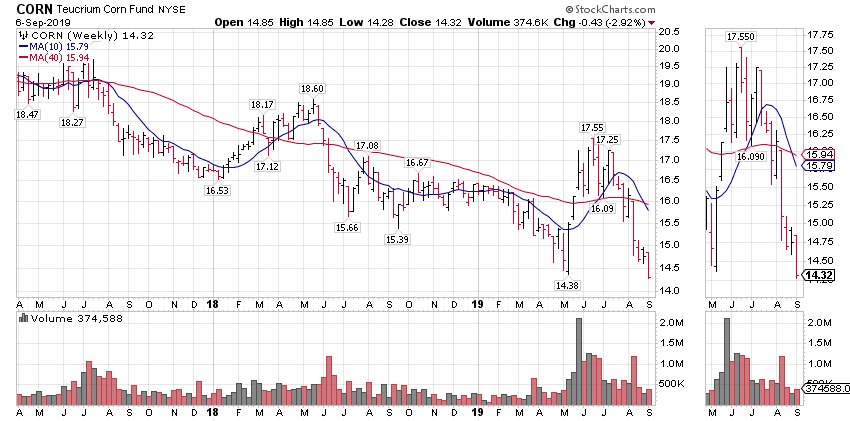
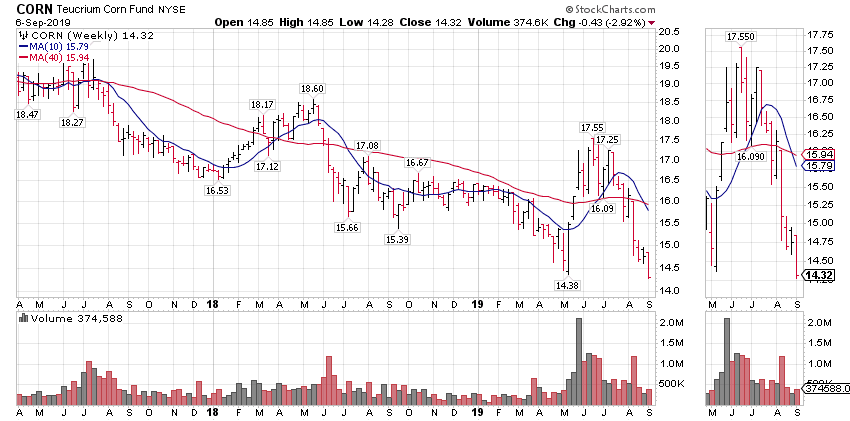
CORN, an equity ETF, fell below the May low on Friday (see Corn Weekly). The outcome ensures that the bullish promoters, those screaming BUY the rally created by poor spring planting conditions despite aggressive strong hand distribution, will disappear. Aggressive distribution was revealed by a sharp decline in corn's DI to nearly -100% in early Juuly; -100% is DI's maximum distribution (selling) reading.
Where do we go from here? The bears screaming sell the decline won't help, because the decline means they'll control the narrative. Disciplined traders must interpret the actions of the invisible hand, the only expert that matters. The Matrix defines corn's composite trend as Down, Down, Cons. The latter reading, corn's monthly alignment, is the most important. We must watch to see if it flips. A flip of the monthly trend to DOWN would organize and prolong the decline.
Does corn's monthly trend enter downside alignment in the coming weeks? The answer to that question depends on energy (DI) and who's controlling the trend. Corn's DI = -49%, while no longer a bearish setup, it still defines a bearish bias. Energy behind the trend remains bearish until DI > 60%. The oscillation from bearish to bullish setup could take weeks, if not months.
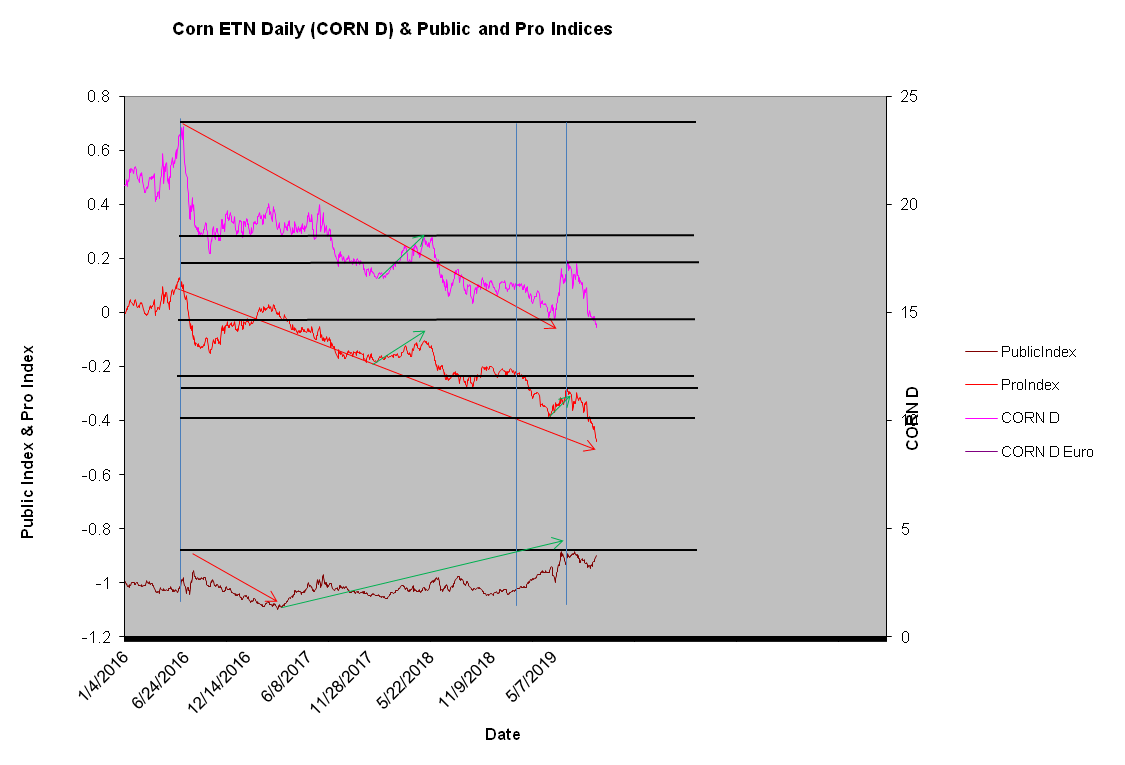
Corn's ProIndex defines professional selling. This is bearish. ProIndex's new lows ahead of price, a bearish divergence, warns of continuation of the decline. A steadily rising trend in the PubIndex suggests all the buying is coming from the retail sector. This is not good! Retail traders are notoriously bad at timing.
Where we go from here is a continuous message defined not by experts but rather than an invisible hand.
Corn Weekly


Corn's DI
Corn ProIndex PubIndex

