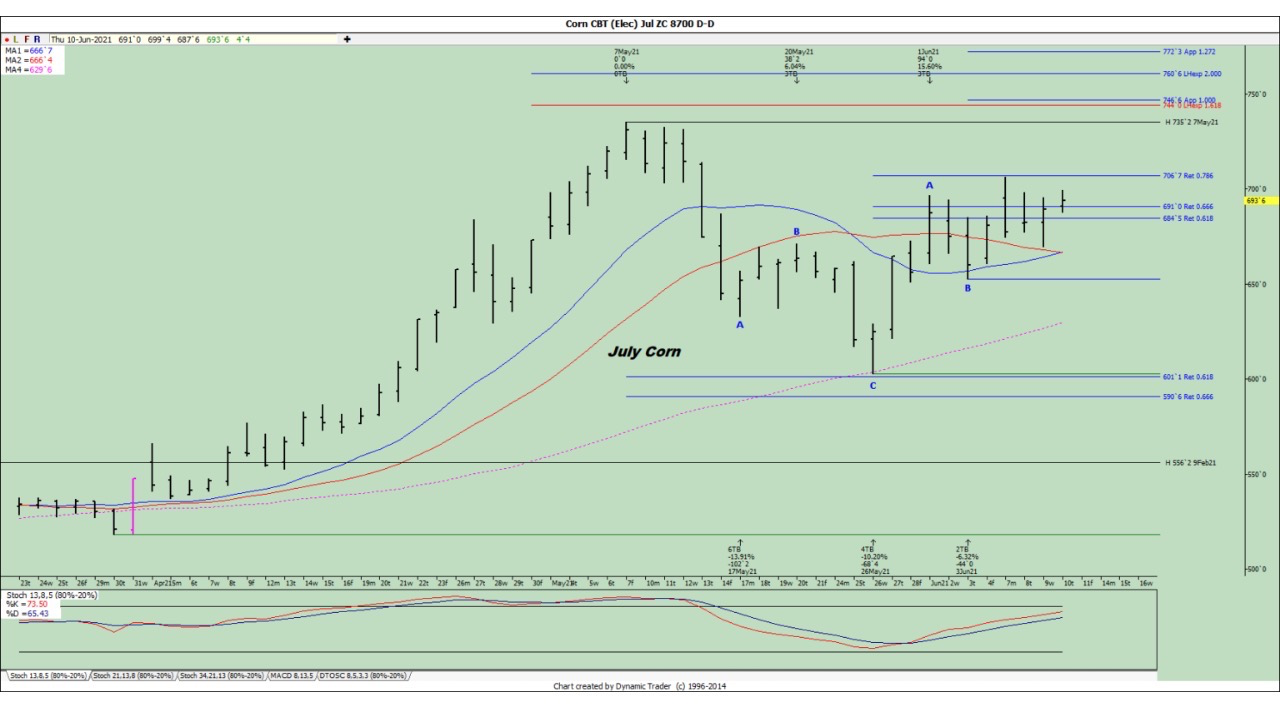
This year’s most explosive agricultural rally has been in soyoil, as roaring demand for biofuels led to a 66% gain on the year. If corn has its way, it might do even better with the US government forecasting the crop’s smallest supply in 8 years.
In the latest WASDE, or World Agricultural Supply and Demand Estimates, released Thursday, the US Department of Agriculture projected corn ending-stocks of 1.107 billion bushels for the 2020/21 marketing year ending Aug 31.
That would be the smallest finishing stocks of corn in a year since 2013.
The front-month corn contract on the Chicago Board of Trade hit a five-week high of $7.18 per bushel on the news before settling at just under $7, for a 1.2% gain on the day.
Year-to-date, CBOT corn is up 44%.
Analysts tracking the trade expected further upside in the coming days for the front-month July corn contract, potentially in the direction of $7.50 per bushel.
While that would still not get corn to record highs like soyoil, it would be corn’s highest prices since December 2012.

Chart courtesy of the Hueber Report
Mike Zuzolo, president of Global Commodity Analytics, observed that aside from the smallest US corn stockpiles in 8 years, the Brazilian corn corp was expected to be shrinking too. Brazil's CONAB slashed its corn crop forecast by nearly 10 million tonnes from its May estimate. Zuzolo said:
"My biggest takeaway is that we have confirmation of a lot tighter South American supplies, and therefore global supply for the next six months in corn."
USDA projected a higher corn ending-stock for 2021/22, with a forecast for 1.357 billion bushels compared with the 1.507 billion bushels it predicted in May. Yet, with a year to go on that, few analysts were willing to bet that those projections won’t change.
Jack Scoville, chief crop analyst at Price Futures Group noted that corn, primarily processed for ethanol in the United States other than for animal feed and human consumption, was seeing lackluster demand from buyers awaiting a price break.
“Demand remains disappointing but the production might not be there for better demand in the coming year,” Scoville said.
So, how much higher could corn prices go?
Investing.com’s Daily Technical Outlook suggests new peaks between $7.30 and nearly $7.50 per bushel for the July corn contract on CBOT, depending on which of its top two variants—Fibonacci or Classic—that appeals to market participants.
Under the Fibonacci model, the near-term high for corn is in a range of between $7.20 and $7.31. In the Classic mode, the peak could be between $7.31 and $7.45.
Veteran grains analyst Dan Hueber, who authors the Hueber Report, concurs with the Investing.com outlook.
“We have yet to reach back to the high posed on Monday, but it is easily within striking distance,” he said in Thursday’s post of the Hueber Report.
“Daily stochastics continue to work steadily higher and unless there is an obstacle tossed in the way, i.e., rain or a silly USDA number, it would appear we have the potential to make a run at the exiting highs at 7.35 and could even take a shot at 7.45.”
Disclaimer: Barani Krishnan uses a range of views outside his own to bring diversity to his analysis of any market. For neutrality, he sometimes presents contrarian views and market variables. He does not hold a position in the commodities and securities he writes about.
