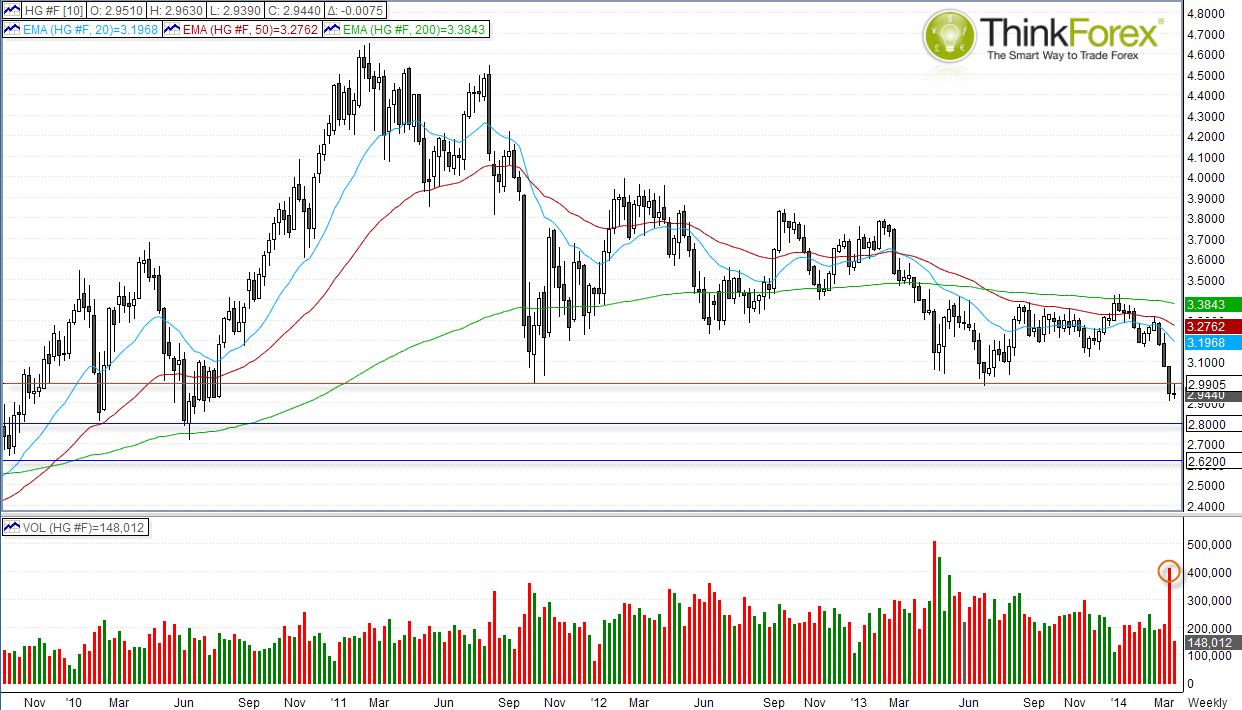
With Copper currently down 13% year to date and holding below a key resistance level, it appears as though Copper may be on track for a move down to $2.80.
The break below the 2011 low was done on very high volume to provide confidence of a continuation of the sell-off. Already we have seen the $2.33-$3.00 resistance area tested and respected, so as long as we remain below these levels I believe we could see Copper trade down to $2.80 sooner than later.
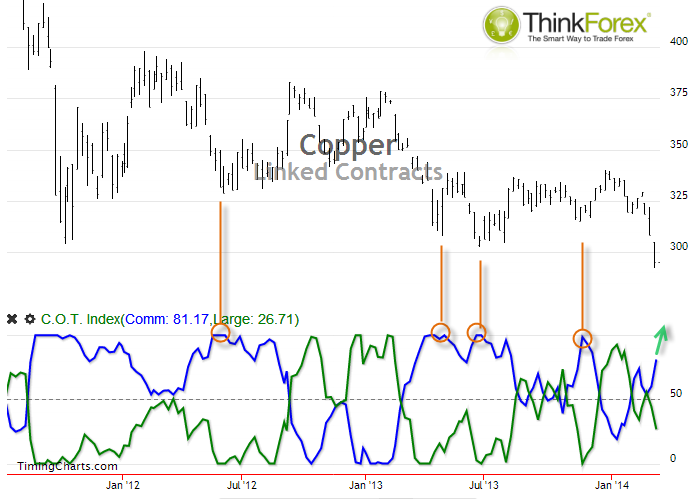
Below I have also included the COTS (Commitments of Traders) report shown as an Index. This simply takes the net positioning of longs vs shorts and places it into a percentile so it ranges between 0 and 100 like an oscillator. As it uses a 52 week percentile, it helps quantify and aid with sentiment extremes. We can see that the market bottoms have occurred in areas where COTS Non-Commercial traders have been too heavily trading on the same side to see a subsequent reversal. Currently we do not see such a sentiment extreme which suggests that Copper may indeed have further room to continue dropping, in line with the current trade.
A break above $3.00 only opens up the potential for a much deeper pullback and we could indeed trade as high as $3.30 swing high before the bearish trend on the weekly chart comes under threat.

