Copper has been said to be the backbone of the economy. Heavily used in the housing market and industry, demand for it is a barometer of economic strength. Or so the story goes. So with the 4 year move lower in the price of copper many see a declining economy. That may be.
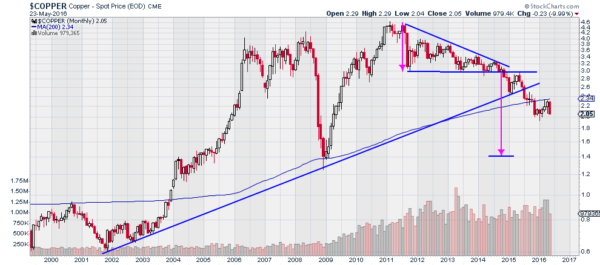
The price of copper had started to recover at the beginning of the year, but with just 5 trading days left in May it now looks like it will erase all of that and may even make a new low. The monthly chart below shows the strong move lower in May as a solid red candle, at the low of the month.

Technically there is a lot wrong with copper. If you look back to 2003, copper first moved above its 200 month moving average (SMA). This smoothing mechanism has acted as support since, until the price fell below it at the end of 2015. It pushed higher to retest that 200 month SMA in March only to fall back.
The price of copper also broke down below the 13 year rising trend support line in 2015. It has not looked back since doing this. The start of the break down, when it fell out of a descending triangle at the end of 2014 gives a potential target. This pattern suggests copper could fall as low as 1.40.
Of course copper could also be consolidating and bottoming now. The key will be holding above the round number 2.00. Below that and you can have more confidence that the waterfall downtrend has resumed.
Disclaimer: The information in this blog post represents my own opinions and does not contain a recommendation for any particular security or investment. I or my affiliates may hold positions or other interests in securities mentioned in the Blog, please see my Disclaimer page for my full disclaimer.
