💎 Fed’s first rate cut since 2020 set to trigger market. Find undervalued gems with Fair ValueSee Undervalued Stocks

Copper In Sideways Trend, Resistance 448-450

Published 02/17/2014, 05:41 AM
Updated 05/14/2017, 06:45 AM


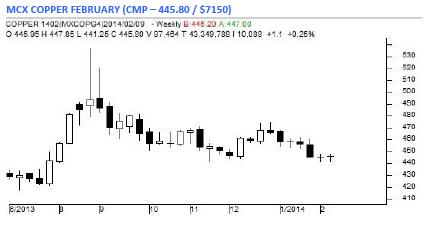
MCX Copper February as seen in the weekly chart above has opened at 445.95 levels initially moved higher, but has found good resistance at 447.85 levels. Later prices fell sharply towards 441.25 levels, but could not sustain recovered sharply towards 447.50 levels and finally closed marginally higher from the previous weeks closing levels.

For the next week we expect Copper prices to find support in the range of 442 –441 levels. Trading consistently below 440 levels would lead towards the strong support at 437 levels and then finally towards the major support at 426 levels.

Resistance is now observed in the range of 448-450 levels. Trading consistently above 452 levels would lead towards the strong resistance at 460 levels, and then finally towards the Major resistance at 470 levels.

MCX / LME Copper Trading levels for the week
Trend: Sideways
S1 – 442.00/ $7090 R1 – 448.60/ $7190
S2 – 437.00/ $7030 R2 – 460.00/ $7230

Weekly Recommendation: Neutral

Latest comments

Loading next article…
Risk Disclosure: Trading in financial instruments and/or cryptocurrencies involves high risks including the risk of losing some, or all, of your investment amount, and may not be suitable for all investors. Prices of cryptocurrencies are extremely volatile and may be affected by external factors such as financial, regulatory or political events. Trading on margin increases the financial risks.
Before deciding to trade in financial instrument or cryptocurrencies you should be fully informed of the risks and costs associated with trading the financial markets, carefully consider your investment objectives, level of experience, and risk appetite, and seek professional advice where needed.
Fusion Media would like to remind you that the data contained in this website is not necessarily real-time nor accurate. The data and prices on the website are not necessarily provided by any market or exchange, but may be provided by market makers, and so prices may not be accurate and may differ from the actual price at any given market, meaning prices are indicative and not appropriate for trading purposes. Fusion Media and any provider of the data contained in this website will not accept liability for any loss or damage as a result of your trading, or your reliance on the information contained within this website.
It is prohibited to use, store, reproduce, display, modify, transmit or distribute the data contained in this website without the explicit prior written permission of Fusion Media and/or the data provider. All intellectual property rights are reserved by the providers and/or the exchange providing the data contained in this website.
Fusion Media may be compensated by the advertisers that appear on the website, based on your interaction with the advertisements or advertisers.
© 2007-2024 - Fusion Media Limited. All Rights Reserved.