Copper Counter-Trend Rally Could Peak

Published 05/22/2020, 03:46 PM
Updated 07/09/2023, 06:31 AM

Could old Doc Copper be sending an important message about the overall health of the global economy and the stock market in the next couple of weeks? It appears it could!

This chart looks at Copper Futures on a weekly basis over the past  seven years. Doc Copper looks to have double topped in late 2017 and early 2018. After the double top, copper has continued to create a series of lower highs, which sends a bearish divergence message to stocks.

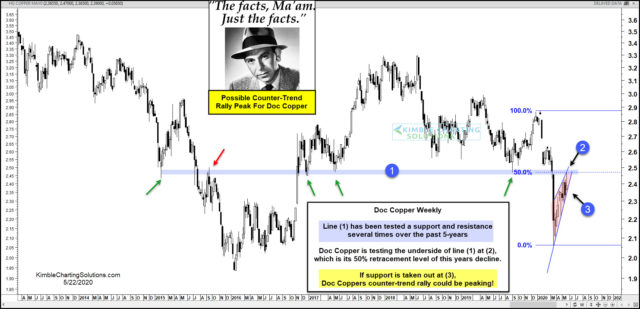
Numerous highs and lows have taken place along the line (1) over the past  five years. The rally off the March lows has Doc Copper testing the underside of line (1) and its 50% Fibonacci retracement at (2) this week. While testing the underside of resistance, it is attempting to create a weekly bearish reversal pattern.

Commodity and stock market bulls would receive a positive message if Doc Copper can break above dual resistance at (2).

If Doc Copper finishes the week with a bearish reversal pattern and then it proceeds to break rising support at (3), it would send a negative message to the prospects of a global rebound in commodities and stocks!

Latest comments

Loading next article…
Risk Disclosure: Trading in financial instruments and/or cryptocurrencies involves high risks including the risk of losing some, or all, of your investment amount, and may not be suitable for all investors. Prices of cryptocurrencies are extremely volatile and may be affected by external factors such as financial, regulatory or political events. Trading on margin increases the financial risks.
Before deciding to trade in financial instrument or cryptocurrencies you should be fully informed of the risks and costs associated with trading the financial markets, carefully consider your investment objectives, level of experience, and risk appetite, and seek professional advice where needed.
Fusion Media would like to remind you that the data contained in this website is not necessarily real-time nor accurate. The data and prices on the website are not necessarily provided by any market or exchange, but may be provided by market makers, and so prices may not be accurate and may differ from the actual price at any given market, meaning prices are indicative and not appropriate for trading purposes. Fusion Media and any provider of the data contained in this website will not accept liability for any loss or damage as a result of your trading, or your reliance on the information contained within this website.
It is prohibited to use, store, reproduce, display, modify, transmit or distribute the data contained in this website without the explicit prior written permission of Fusion Media and/or the data provider. All intellectual property rights are reserved by the providers and/or the exchange providing the data contained in this website.
Fusion Media may be compensated by the advertisers that appear on the website, based on your interaction with the advertisements or advertisers.
© 2007-2025 - Fusion Media Limited. All Rights Reserved.