Nearer term copper outlook:
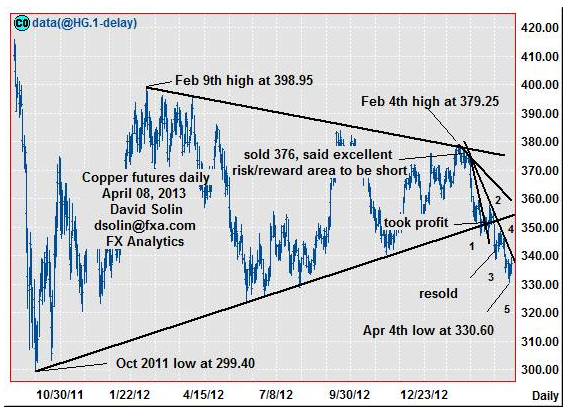
Copper remains heavy in the decline from the Feb 4th high at 379.25, and after finally resolving lower from the long discussed contracting triangle/pennant that had been forming since Oct 2011. Though still very bearish over the longer term (see longer term below), nearer term the market is quite oversold after the last 2 months of sharp declines. Note too that the market appears to be within the final leg of the decline from Feb (wave 5, see numbering on daily chart below) and suggests that risk for at least a few weeks of a countertrend bounce/correcting, is rising. Nearby support is seen at the recent 330.60 low, while resistance is seen at the bearish trendline from Feb (currently at 340.50/341.00).
Strategy/position:
Short from the Mar 19th resell at 340.25, but given the increasing risk for at least a few weeks of correcting/consolidating, would continue to use the aggressive stop on a close above that bearish trendline from late Feb (currently at 340.50/341.00), to maintain a good risk/reward n the position.
Long term outlook:
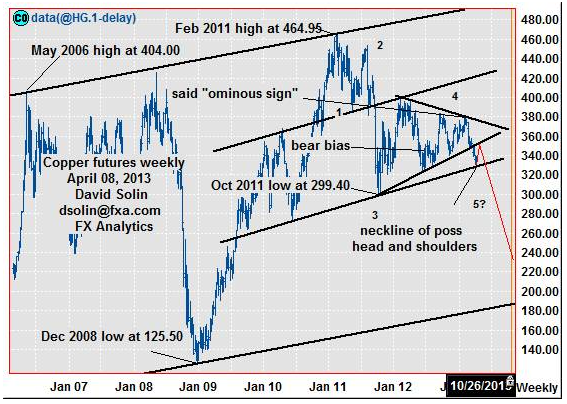
Warned in early Feb of the "ominous" outlook for copper as the market was trading near the ceiling of the triangle from Oct (then near 380, continuation pattern) and within the larger, bearish head and shoulders pattern that has been forming for nearly the last 4 years (another bearish pattern, pattern in a pattern). As discussed above, the market has indeed resolved lower from the pennant, currently trading near the neckline of the larger head and shoulders. Though an eventual downside break of this key support is favored, targeting eventual declines to 295/99 (both the Oct 2011 low and a 50% retracement from the Dec 2008 low at 125.50) and the base of bullish channel from May 2006 (currently at 180/83), this neckline support is likely to hold for at least a few weeks/ month first (see in red on weekly chart/2nd chart below, fits the shorter term view above). Note too its not uncommon for markets to retest the broken base of the triangles (currently at 352/355) before resuming the longer term trendline (down in this case, see in red on weekly chart/2nmd chart below).
Strategy/position:
Despite scope for a month of consolidating/correcting higher, still very negative over the long term so would maintain the longer term bearish bias that was put in place way back on Jan 9th at 367.
Nearer term: resold Mar 19 at 340.25, stop on close above the bear t-line from Feb (cur 340.50/341.00).
Last : short Feb 8 at 376, took profit Mar 7 above bear t-line from mid Feb (348, closed 350, 26 points).
Longer term: bear bias on Jan 9th at 367, further, sharply lower prices still favored.


