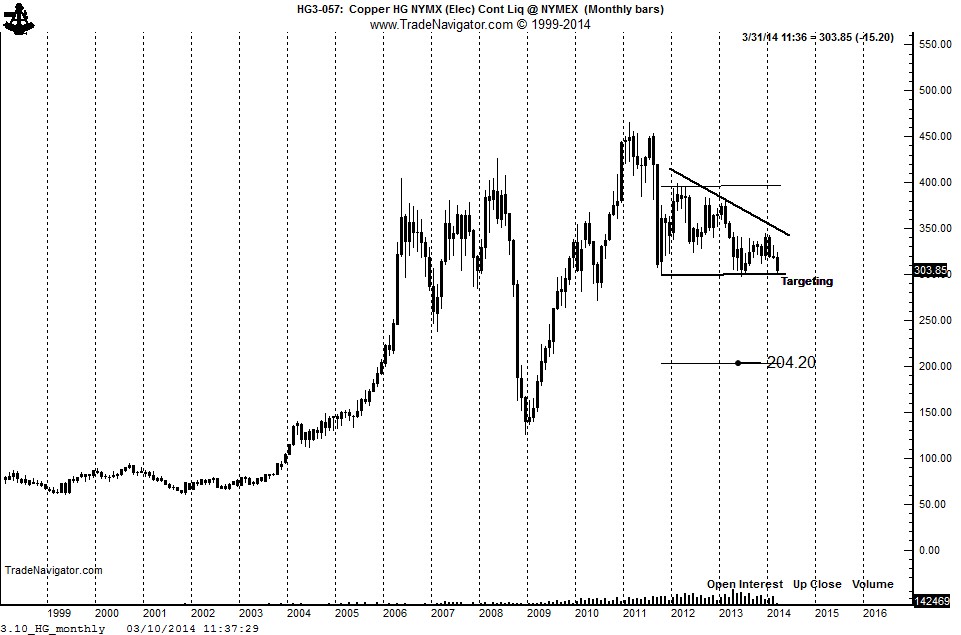
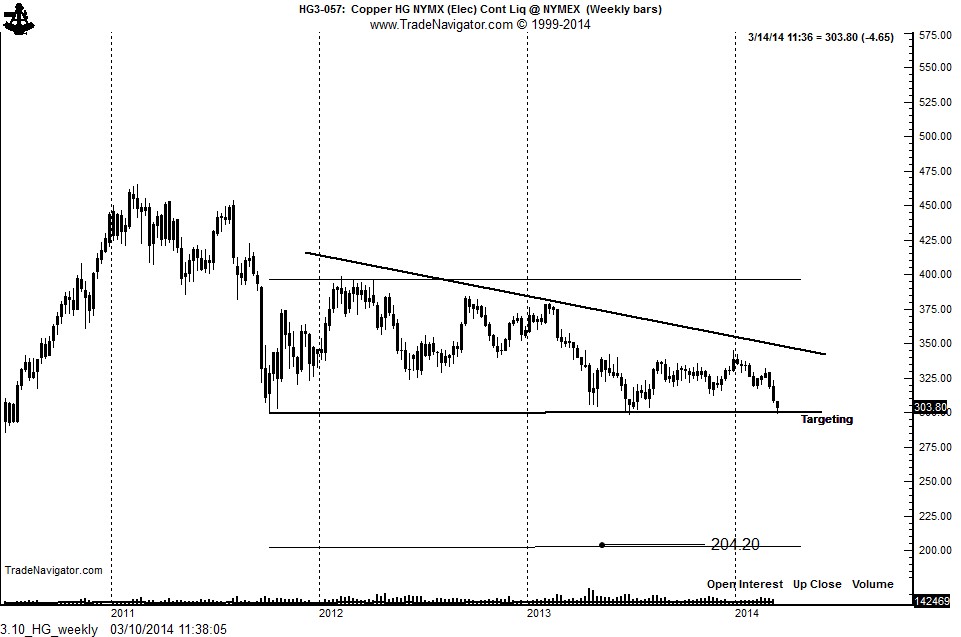
Copper Is Forming A 30-Month Descending Triangle
The monthly and weekly graphs below display a possible descending triangle in Copper dating back to the late 2011 low or mid 2011 high, depending upon how the upper boundary is drawn. A decisive close below $3 would complete this pattern and generate a target as low as $2.04.


