🐂 Not all bull runs are created equal. November’s AI picks include 5 stocks up +20% eachUnlock Stocks

Copper's A 'Buy' With Caveats

Published 01/31/2017, 10:56 AM
Updated 07/09/2023, 06:31 AM
HG
-
JJC
-

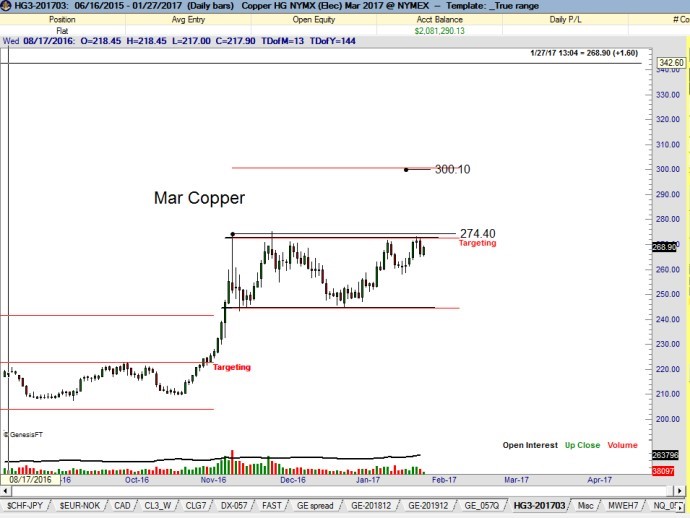
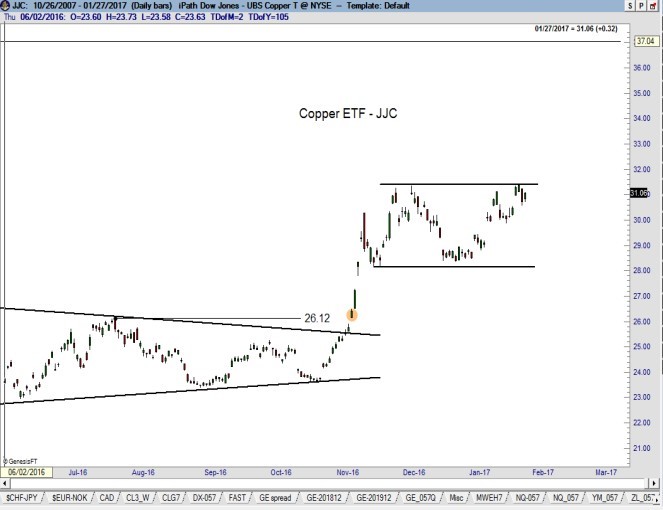
Copper's daily and weekly charts appear to be forming an 11-week rectangle or ascending triangle, depending on how the boundary lines are drawn. A move and close above 274.40 would complete this consolidation pattern and establish an upside profit target of 300.

iPath Bloomberg Copper Subindex Total Return Exp 22 Oct 2037 (NYSE:JJC)
iPath Bloomberg Copper Subindex Total Return Daily Copper

Buy, But...

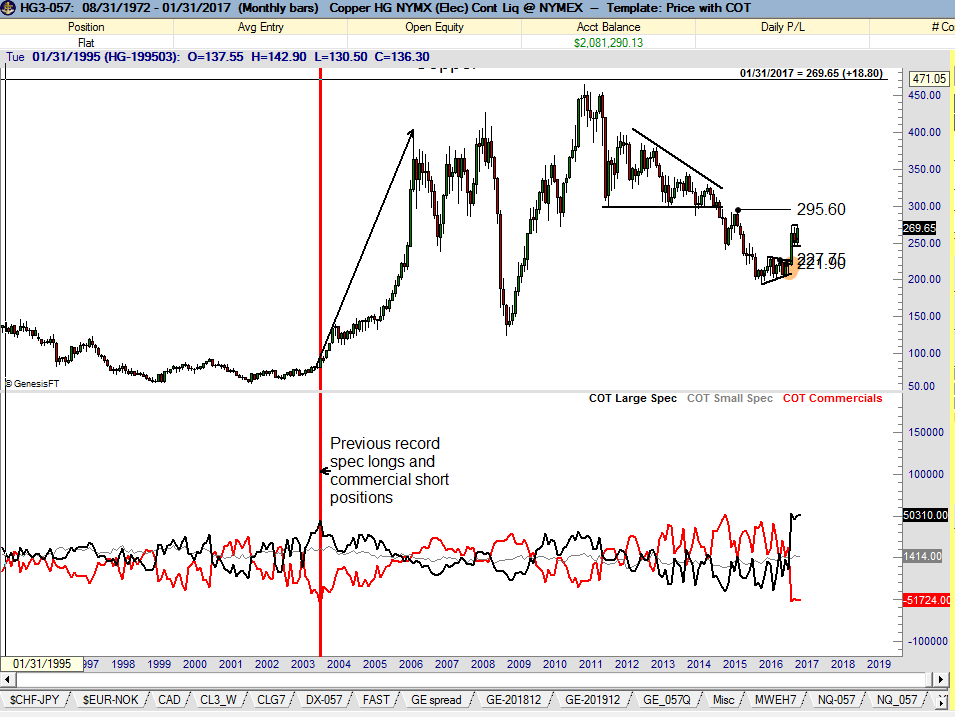
I am willing to buy copper's breakout, but with a huge caveat. The market is coming off a period of all-time record spec-long and commercial-short positions (by a massive margin compared to the previous records). Normally I would shy away from buying a market with this COT profile. Yet, there have been rare occasions when a market is resolved in the direction of a record spec-long COT profile. In fact, the most outstanding example of capitulation by commercial interests occurred in in Oct. 2003 – the period with the previous spec-long and commercial-short record holdings (see red vertical line on the monthly chart). In that case, the market went straight up for 2½ years with prices quadrupling. Usually commercial interests are right – but when they are wrong, they are dead wrong.
Monthly Copper

Latest comments

Loading next article…
Risk Disclosure: Trading in financial instruments and/or cryptocurrencies involves high risks including the risk of losing some, or all, of your investment amount, and may not be suitable for all investors. Prices of cryptocurrencies are extremely volatile and may be affected by external factors such as financial, regulatory or political events. Trading on margin increases the financial risks.
Before deciding to trade in financial instrument or cryptocurrencies you should be fully informed of the risks and costs associated with trading the financial markets, carefully consider your investment objectives, level of experience, and risk appetite, and seek professional advice where needed.
Fusion Media would like to remind you that the data contained in this website is not necessarily real-time nor accurate. The data and prices on the website are not necessarily provided by any market or exchange, but may be provided by market makers, and so prices may not be accurate and may differ from the actual price at any given market, meaning prices are indicative and not appropriate for trading purposes. Fusion Media and any provider of the data contained in this website will not accept liability for any loss or damage as a result of your trading, or your reliance on the information contained within this website.
It is prohibited to use, store, reproduce, display, modify, transmit or distribute the data contained in this website without the explicit prior written permission of Fusion Media and/or the data provider. All intellectual property rights are reserved by the providers and/or the exchange providing the data contained in this website.
Fusion Media may be compensated by the advertisers that appear on the website, based on your interaction with the advertisements or advertisers.
© 2007-2024 - Fusion Media Limited. All Rights Reserved.