Continental Resources, Inc. (CLR) is an independent crude oil and natural gas exploration and production company with operations in the North, South and East regions of the United States.
CLR caught my attention because the implied is depressed to my two favorite historical realized measures while earnings are due out right after Feb expiry.
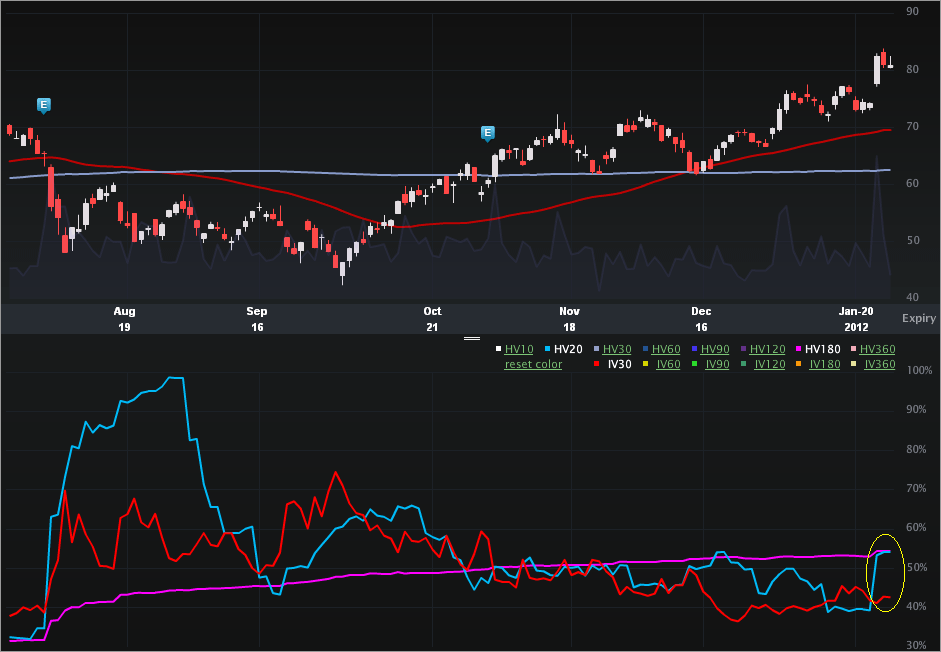
Let's start with the Charts Tab (6 months) is below. The top portion is the stock price, the bottom is the vol (IV30™ - red vs HV20 - blue vs HV180 - pink).

On the stock side, we can see nice run up of late from mid $40's to now over $80 in just ~four months. In that same time period, the implied has dipped from the mid 70%'s to the low 40%'s. As of this writing the implied is trading well below the HV20™ and HV180™. Specifically:
IV30™: 42.55
HV20™: 54.19
HV180™: 54.46
Looking back to the stock chart, we can see an over $8 pop on 1-25-2012. Here's a news snippet from that day:
"What: Shares of oil and natural gas exploration company Continental Resources (NYSE: CLR ) are gushing higher by 10% today following an update on the company's fourth-quarter output.
So what: The fourth quarter was kind to Continental. The company saw its production rate increase by 57% to 75,219 barrels of oil equivalent per day. It also increased its proven reserves by 39% to 508 million barrels of oil based on results from drilling in the Bakken shale region (of which it is the largest petroleum leaseholder) and in the Anadarko Woodford region in Oklahoma.
The company also noted that it would hold off on drilling natural gas wells in the Bakken Shale region until at least 2014 because of the low price currently associated with the fuel. Continental's positive outlook also resulted in Standard & Poor's raising the company's debt level one notch to BB+."
Source: TheMotleyFool.com via Yahoo! finance -- Continental Resources Shares Popped: What You Need to Know, written by Sean Williams.
That's pretty good news, and the stock reaction has artificially elevated the HV20™ (and thus the implied looks depressed to that measure). Still, the 52 wk range in IV30™ is [33.74%, 74.54%], putting the current level in the 21st percentile (annual).
Let's turn to the Skew Tab.

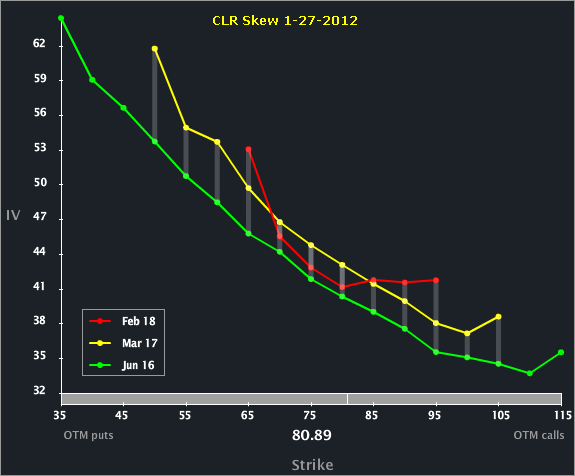
There's actually not a whole lot going on here -- the skew shape is normal and all of the front three expiries show similar shapes. We can see that the ATM vol in Mar is elevated to the other months -- that's due to earnings which are due out on 2-22-2012.
Let's turn to the Options Tab.

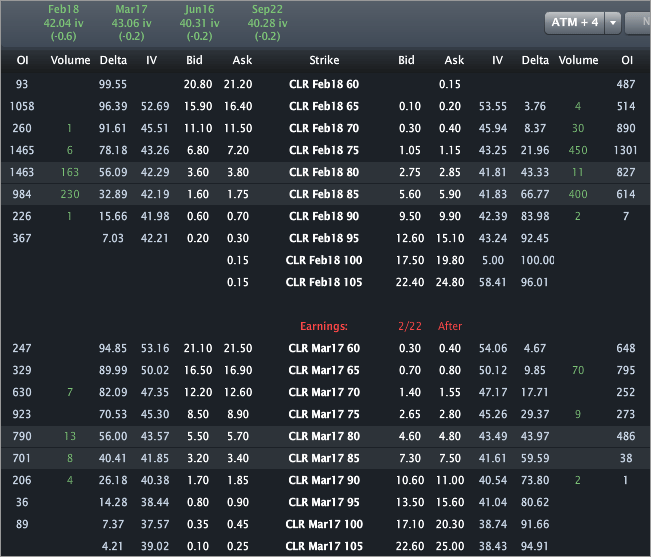
We can see the ATM straddle in Mar is priced to ~43.50% which is just a touch above the IV30™. For the two days before earnings to the day after for the last two earnings cycles CLR has moved from $58.65 to $65.44 and from $65.38 to $54.20 for the Nov 2011 and Aug 2011 earnings reports, respectively. That's a mouth full -- the point being, the stock moved fairly substantially surrounding earnings the last two cycles.
This is trade analysis, not a recommendation.
CLR caught my attention because the implied is depressed to my two favorite historical realized measures while earnings are due out right after Feb expiry.
Let's start with the Charts Tab (6 months) is below. The top portion is the stock price, the bottom is the vol (IV30™ - red vs HV20 - blue vs HV180 - pink).

On the stock side, we can see nice run up of late from mid $40's to now over $80 in just ~four months. In that same time period, the implied has dipped from the mid 70%'s to the low 40%'s. As of this writing the implied is trading well below the HV20™ and HV180™. Specifically:
IV30™: 42.55
HV20™: 54.19
HV180™: 54.46
Looking back to the stock chart, we can see an over $8 pop on 1-25-2012. Here's a news snippet from that day:
"What: Shares of oil and natural gas exploration company Continental Resources (NYSE: CLR ) are gushing higher by 10% today following an update on the company's fourth-quarter output.
So what: The fourth quarter was kind to Continental. The company saw its production rate increase by 57% to 75,219 barrels of oil equivalent per day. It also increased its proven reserves by 39% to 508 million barrels of oil based on results from drilling in the Bakken shale region (of which it is the largest petroleum leaseholder) and in the Anadarko Woodford region in Oklahoma.
The company also noted that it would hold off on drilling natural gas wells in the Bakken Shale region until at least 2014 because of the low price currently associated with the fuel. Continental's positive outlook also resulted in Standard & Poor's raising the company's debt level one notch to BB+."
Source: TheMotleyFool.com via Yahoo! finance -- Continental Resources Shares Popped: What You Need to Know, written by Sean Williams.
That's pretty good news, and the stock reaction has artificially elevated the HV20™ (and thus the implied looks depressed to that measure). Still, the 52 wk range in IV30™ is [33.74%, 74.54%], putting the current level in the 21st percentile (annual).
Let's turn to the Skew Tab.

There's actually not a whole lot going on here -- the skew shape is normal and all of the front three expiries show similar shapes. We can see that the ATM vol in Mar is elevated to the other months -- that's due to earnings which are due out on 2-22-2012.
Let's turn to the Options Tab.

We can see the ATM straddle in Mar is priced to ~43.50% which is just a touch above the IV30™. For the two days before earnings to the day after for the last two earnings cycles CLR has moved from $58.65 to $65.44 and from $65.38 to $54.20 for the Nov 2011 and Aug 2011 earnings reports, respectively. That's a mouth full -- the point being, the stock moved fairly substantially surrounding earnings the last two cycles.
This is trade analysis, not a recommendation.
