Technical trading does not have to be hard or complicated. In fact many will tell you the more complicated the system the harder it is to win. 2 months ago I showed you an easy way to avoid the noise of a choppy market with Renko Charts. It is easy enough to follow the buy and sell signals in Renko Charts, but remember that they are formed from price action as well. Technical analysis can work on them too!

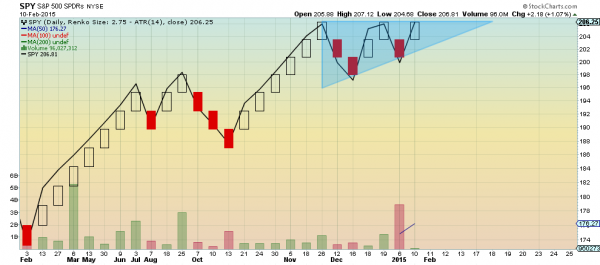
The chart for the SPY shows a really simple example. Since late November the Renko Chart shows SPY bouncing around, flipping signals often. But there is also an Ascending Triangle forming in that price action. A series of higher lows against flat resistance. You can see the last brick against the top of the triangle. The brick size is 2.75 so it will take any print over 209.00 to break out higher, but then a target of 214.50 is in play. Set a buy stop over 209 or watch the intraday action more closely.

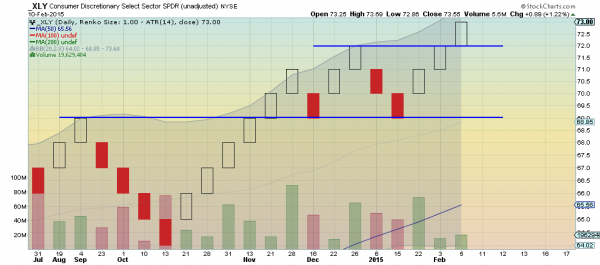
If you want to drill down a little further there look to the Consumer Discretionary Select Sector SPDR (ARCA:XLY). The Renko Chart above shows a buy signal and a break of a channel higher. The standard daily Candlestick chart also showed a break out Tuesday and it closed at an all-time high. Yes, the consumer seems set to lead the markets higher.
Disclaimer: The information in this blog post represents my own opinions and does not contain a recommendation for any particular security or investment. I or my affiliates may hold positions or other interests in securities mentioned in the Blog, please see my Disclaimer page for my full disclaimer.
