Late last week the consumer credit report for December 2013 was issued by the Federal Reserve. I am beginning to wonder if the consumer is not getting drunk again on credit.
The first indication something is up is the growing divergence between consumer spending and consumer income occurring over the last few months.
Real Disposable Personal Income (blue line) and Real Personal Consumption Expenditures (red line)
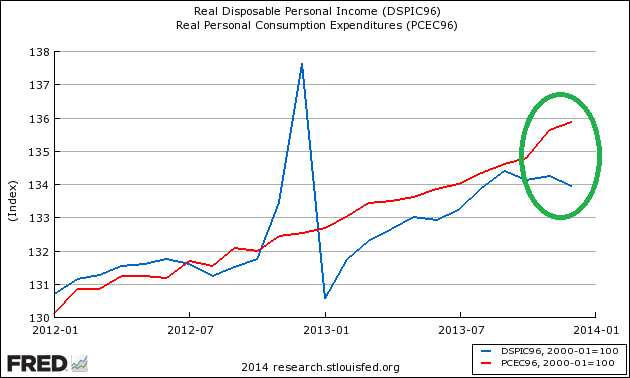
Since the end of the Great Recession, the consumer seemingly went cold turkey from deficit spending (whilst the government did the opposite). Now the government is cutting back on the rate of growth of deficit spending, whilst the consumer is doing the opposite.
Indexed to Jan 2000, Growth of Real Disposable Income (blue line) to Real Expenditures (red line)
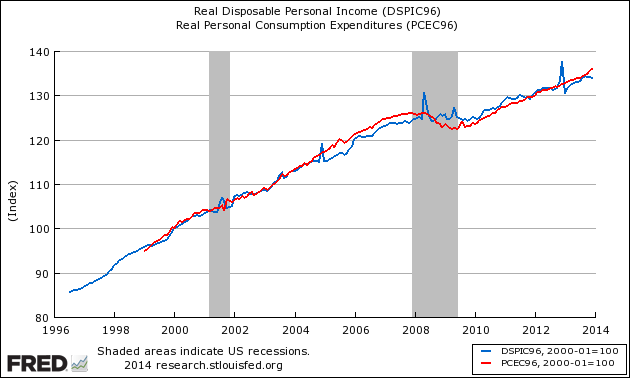
As you can see from the above graph, consumer deficit spending is a 2013 phenomenon – previously, since the Great Recession, the consumer was not outspending income.
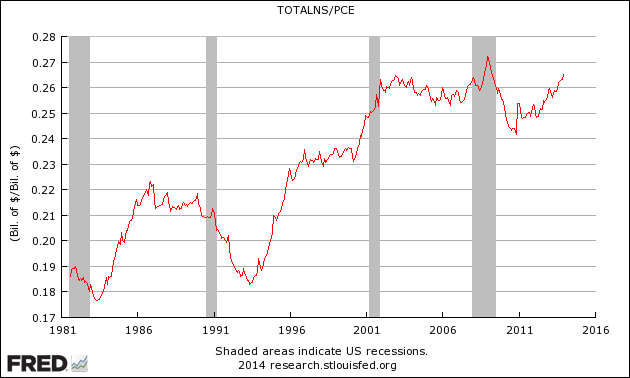
The graph below shows consumer credit outstanding (this data series does not include mortgages) is now near historical highs again.
Ratio of Total Consumer Loans Outstanding to Consumer Spending
To get a feel of inflation adjusted consumer credit, the following graph is inflation adjusted consumer credit using the CPI-U (less shelter) – this is expressing consumer credit in 1982 dollars. It is evident even on an inflation adjusted basis, consumer credit is growing
Inflation Adjusted Consumer Credit
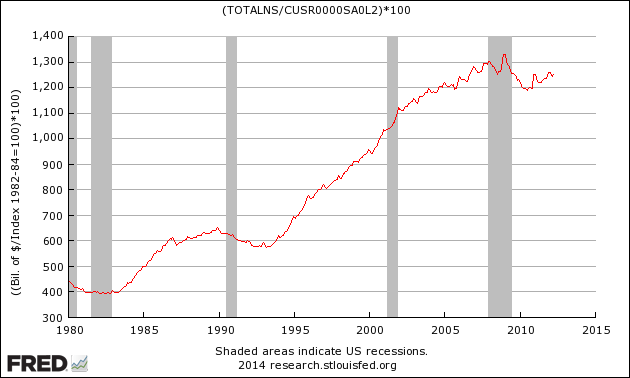
Consumer credit may again be in the warning zone.
Other Economic News this Week:
The Econintersect economic forecast for February 2014 continues to confirm a moderately improving economy without the roller coaster effect seen from the end of the Great Recession to mid 2013. Is this suggesting 2014 will be a good year? – This remains to be seen.
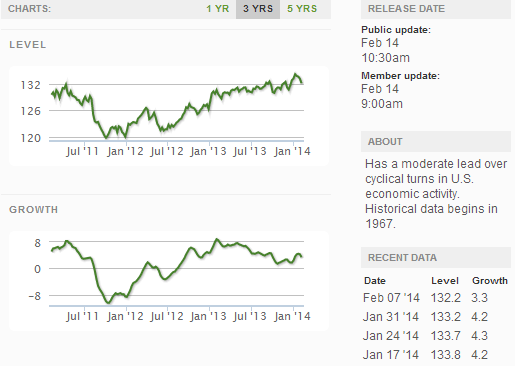
The ECRI WLI growth index value has been weakly in positive territory for over four months – but in a noticeable improvement trend. The index is indicating the economy six month from today will be slightly better than it is today.
Current ECRI WLI Growth Index
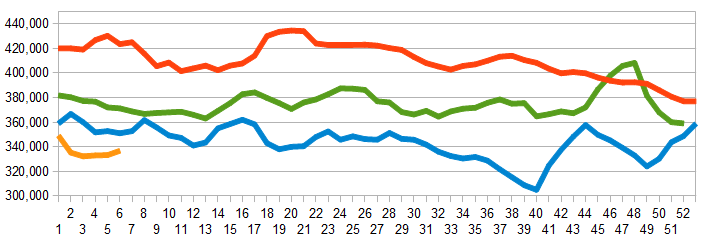
Initial unemployment claims went from 331,000 (reported last week) to 339,000 this week. Historically, claims exceeding 400,000 per week usually occur when employment gains are less than the workforce growth, resulting in an increasing unemployment rate. The real gauge – the 4 week moving average – marginally worsened from 334,000 (reported last week) to 336,750. Because of the noise (week-to-week movements from abnormal events AND the backward revisions to previous weeks releases), the 4-week average remains the reliable gauge.
Weekly Initial Unemployment Claims – 4 Week Average – Seasonally Adjusted – 2011 (red line), 2012 (green line), 2013 (blue line), 2014 (orange line)
Bankruptcies this Week: Lexico Resources International, First Mariner Bancorp, Cereplast, Optim Energy, Event Rentals
Weekly Economic Release Scorecard:
Click here to view the scorecard table below with active hyperlinks


