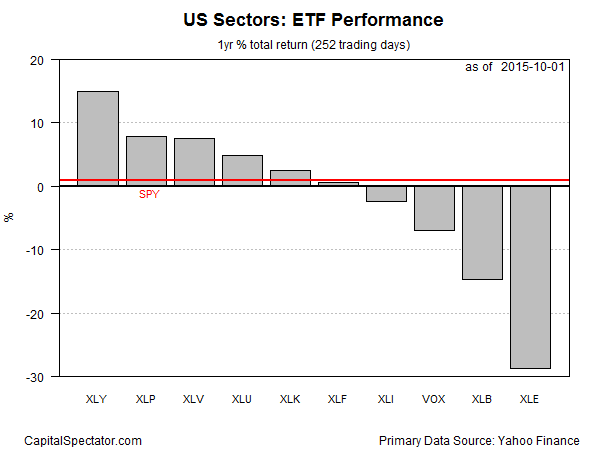
The recent market turbulence has knocked the health care sector from its leadership role in performance terms among the major US equity sectors. The crown has passed to consumer discretionary stocks, based trailing one-year total return data for a set of ETF proxies. Although all corners of the US equity market have lost ground since August, the selling has reshuffled the leadership structure, leaving the Consumer Discretionary SPDR ETF (XLY) firmly at the front of the horse race.
XLY, which holds consumer-focused stocks such as Amazon (NASDAQ:AMZN) and Walt Disney, is sitting on a 15.3% total return for the trailing one-year period (252 trading days) through yesterday (Oct. 1). That’s roughly twice the gain vs. the second- and third-place performers. XLY’s one-year advance also represents a sizable premium over the US stock market generally. The one-year return for the SPDR S&P 500 ETF (NYSE:SPY) is barely positive at less than 1%.

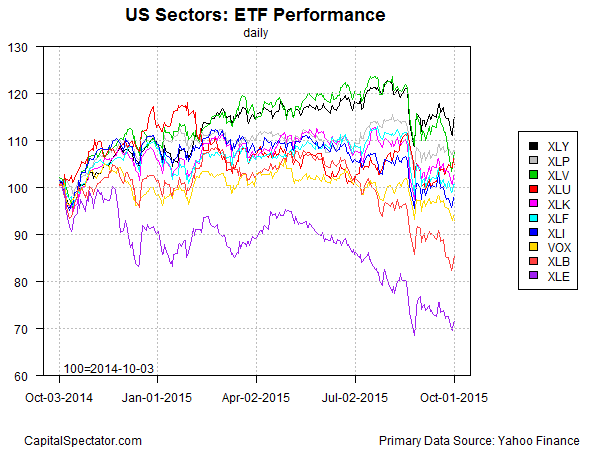
XLY’s strength in recent months is largely a function of relative performance, which is to say that this corner of the market suffered less than stocks generally. But putting all the sector ETFs on a level playing field in terms of total return over the past year shows that XLY’s performance has been more or less steady in recent weeks at a time of heightened volatility in markets overall. In particular, note XLY’s comparatively stable price in the chart below (black line at top) in the third quarter through yesterday’s close vs. the rest of the field.

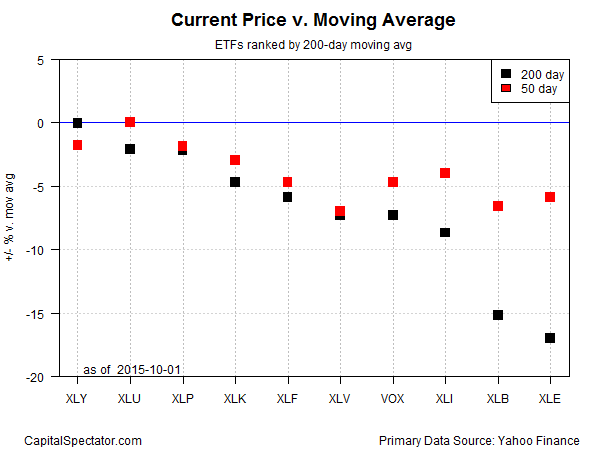
Ranking the major sector ETFs by price momentum also shows XLY in a leadership position, at least in relative terms. The consumer discretionary fund yesterday closed at a slight fraction below its 200-day moving average and less than 2% below its 50-day moving average (based on adjusted total return prices). That’s a neutral to mildly bearish profile, but it looks considerably stronger vs. the other sector ETFs.

Is the relative performance leadership of XLY surprising? Not necessarily. Back in early August, before the selling wave hit, I wondered if XLY “is poised to take the pole position away from health care firms in the weeks ahead?” Two months later, we have the answer.
The key question now is whether XLY’s strength will endure? There’s a case for cautious optimism in the near term, particularly if the US economy proves to be more resilient than expected. Today’s payrolls report from Washington will drop a valuable clue on that front. Meantime, consumer discretionary equities are the worst-performing sector… except when compared with everything else.
Here’s a list of the sector ETFs cited above, with links to summary pages at Morningstar.com for additional research:
