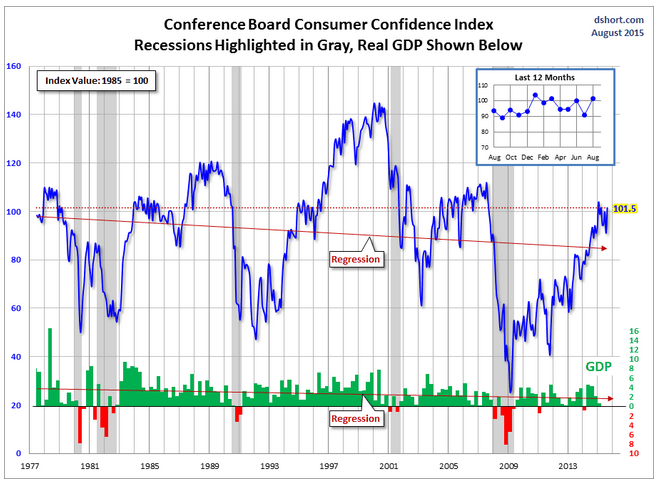
The latest Conference Board Consumer Confidence Index was released yesterday, based on data collected through August 13. The headline number of 101.5 was a significant jump from the July final reading of 91, a downward revision of July's initial 99.8. Yesterday's number was above the Investing.com forecast of 93.4.
Here is an excerpt from the Conference Board press release.
"Consumer confidence rebounded in August, following a sharp decline in July," said Lynn Franco, Director of Economic Indicators at The Conference Board. "Consumers' assessment of current conditions was considerably more upbeat, primarily due to a more favorable appraisal of the labor market. The uncertainty expressed last month about the short-term outlook has dissipated and consumers are once again feeling optimistic about the near future. Income expectations, however, were little improved."
Putting the Latest Number in Context
The chart below is another attempt to evaluate the historical context for this index as a coincident indicator of the economy. Toward this end we have highlighted recessions and included GDP. The regression through the index data shows the long-term trend and highlights the extreme volatility of this indicator. Statisticians may assign little significance to a regression through this sort of data. But the slope resembles the regression trend for real GDP shown below, and it is a more revealing gauge of relative confidence than the 1985 level of 100 that the Conference Board cites as a point of reference.
On a percentile basis, the latest reading is at the 64% level of all the the monthly data points since June 1977. That's an increase from 44% previous month.
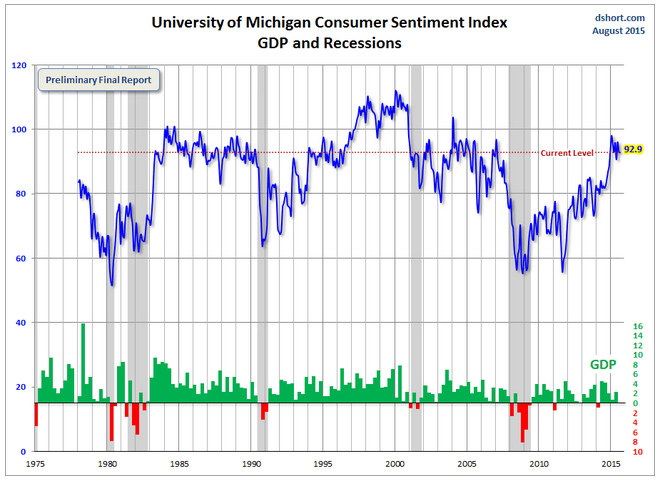
For an additional perspective on consumer attitudes, see the most recent Reuters/University of Michigan Consumer Sentiment Index. Here is the chart from that post.
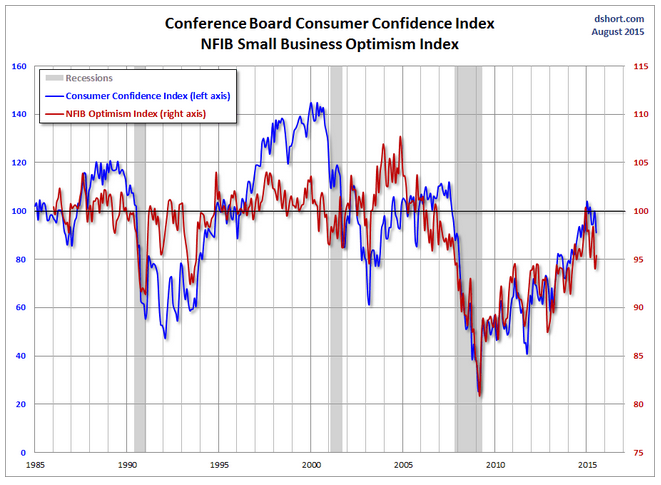
And finally, let's take a look at the correlation between consumer confidence and small business sentiment, the latter by way of the National Federation of Independent Business (NFIB) Small Business Optimism Index. As the chart illustrates, the two have tracked one another fairly closely since the onset of the Financial Crisis.
Which stock should you buy in your very next trade?
With valuations skyrocketing in 2024, many investors are uneasy putting more money into stocks. Unsure where to invest next? Get access to our proven portfolios and discover high-potential opportunities.
In 2024 alone, ProPicks AI identified 2 stocks that surged over 150%, 4 additional stocks that leaped over 30%, and 3 more that climbed over 25%. That's an impressive track record.
With portfolios tailored for Dow stocks, S&P stocks, Tech stocks, and Mid Cap stocks, you can explore various wealth-building strategies.


