This may be a boring subject to many - construction spending. This past week the U.S. Census unveiled a "processing error".
Follow up:
The statement in the November 2015 construction spending release from the U.S. Census Bureau:
In the November 2015 press release, monthly and annual estimates for private residential, total private, total residential and total construction spending for January 2005 through October 2015 have been revised to correct a processing error in the tabulation of data on private residential improvement spending.
A quick look at what happened to construction spending (values in $ millions):

From the above graphic - it is clear that the significant change was that some monies were NOT included in construction spending since 2014 and especially during the 2014 calendar year itself.

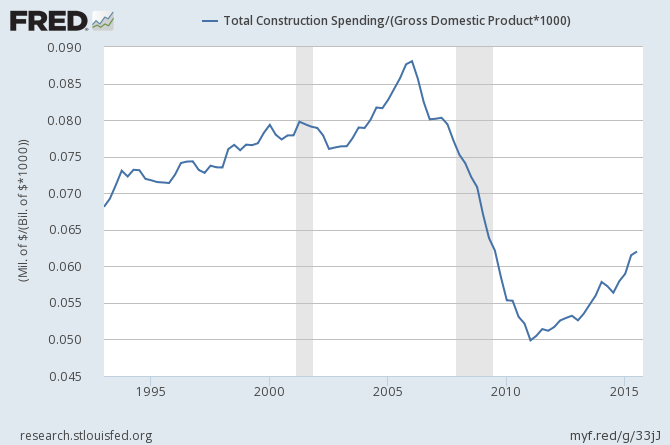
Simply, the area under the curve improved, meaning GDP may have been understated - could be by as much as 0.3 to 0.4 % some quarters. I say MAY because the BEA has to allocate expenditures, and the monies could have been put in the wrong pocket (but still accounted for within GDP). The graph below shows the fraction of GDP attributable to construction. [Note that this is the new construction spending data against the existing GDP data.]

At this point, I would not read too much into this annual revision of construction spending. In any event, construction spending annual rate of growth still exceeds 10% for much of 2015.
Other Economic News this Week:
The Econintersect Economic Index for January 2016 declined - and is now at the lowest value since the end of the Great Recession. The tracked sectors of the economy which showed growth were mostly offset by the sectors in contraction.Our economic index remains in a long term decline since late 2014.
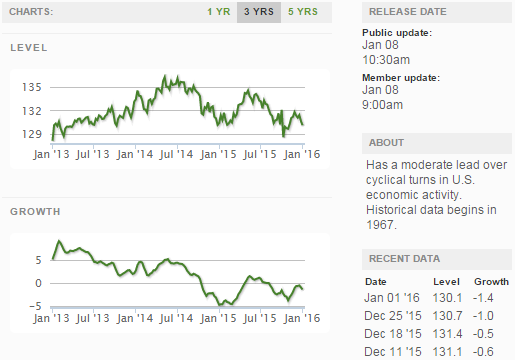
Current ECRI WLI Growth Index
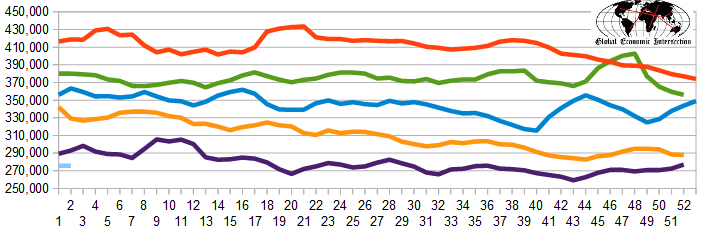
The market (from Bloomberg) was expecting the weekly initial unemployment claims at 260 K to 280 K (consensus 272,000) vs the 277,000 reported. The more important (because of the volatility in the weekly reported claims and seasonality errors in adjusting the data) 4 week moving average moved from 277,000 (reported last week as 277,000) to 275.750. The rolling averages generally have been equal to or under 300,000 since August 2014.
Weekly Initial Unemployment Claims - 4 Week Average - Seasonally Adjusted - 2011 (red line), 2012 (green line), 2013 (blue line), 2014 (orange line), 2015 (violet line)
Bankruptcies this Week:Swift Energy, Privately-held FPMC Austin Realty Partners, Small Business Development Group (fka Virogen)
Click here to view the scorecard table below with active hyperlinks
Weekly Economic Release Scorecard


