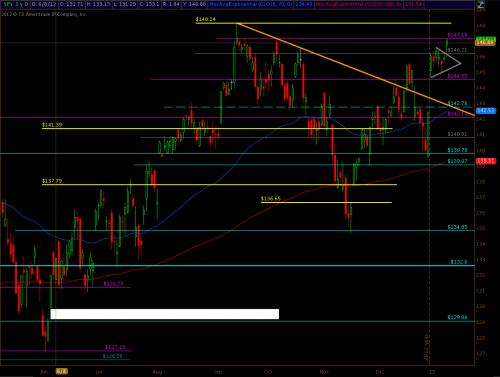
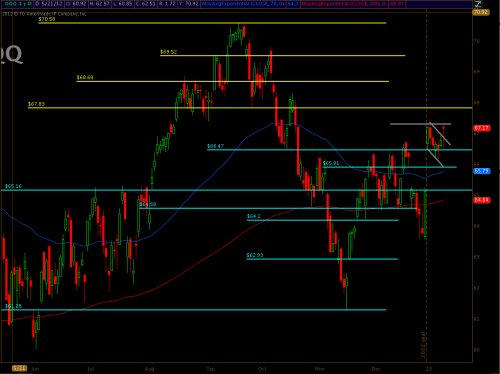
A recent post highlighted the consolidation patterns that formed in the Q’s and on SPY. These ETF’s broke out of these patterns Friday so it is important to review the charts to see where the potential moves are.
SPY: SPY formed a triangle pattern and broke out of it Friday breaking above 146.21. The question is where does SPY head to next? Based on the pattern SPY could move 1.90 points which would put it right near the swing highs at 148.14 and 147.18. The 147.18 level will be strong resistance as this is the two swing highs from the September and October. Bottom line is this move represents a continuation of the upwards move but it must be been seen as a potential end move to the latest uptrend, due to the resistance it will be hitting and a pullback is likely at these levels. 
QQQ: The Q’s formed a flag pattern, and broke through it yesterday. The Q’s are different then SPY in that it has not been able to get above resistance and test the highs from the fall. In fact the Q’s are not able to get above the “fiscal cliff” high at 67.34. In order for the Q’s to advance and continue this breakout, it would need to get above this level first. While there is a technical breakout there is still a chance it can fail without the breakout of that resistance. 
- English (UK)
- English (India)
- English (Canada)
- English (Australia)
- English (South Africa)
- English (Philippines)
- English (Nigeria)
- Deutsch
- Español (España)
- Español (México)
- Français
- Italiano
- Nederlands
- Português (Portugal)
- Polski
- Português (Brasil)
- Русский
- Türkçe
- العربية
- Ελληνικά
- Svenska
- Suomi
- עברית
- 日本語
- 한국어
- 简体中文
- 繁體中文
- Bahasa Indonesia
- Bahasa Melayu
- ไทย
- Tiếng Việt
- हिंदी
Consolidation Pattern Breakouts Of SPY And QQQ
Published 01/13/2013, 01:52 AM
Updated 07/09/2023, 06:31 AM
Consolidation Pattern Breakouts Of SPY And QQQ
Latest comments
Loading next article…
Install Our App
Risk Disclosure: Trading in financial instruments and/or cryptocurrencies involves high risks including the risk of losing some, or all, of your investment amount, and may not be suitable for all investors. Prices of cryptocurrencies are extremely volatile and may be affected by external factors such as financial, regulatory or political events. Trading on margin increases the financial risks.
Before deciding to trade in financial instrument or cryptocurrencies you should be fully informed of the risks and costs associated with trading the financial markets, carefully consider your investment objectives, level of experience, and risk appetite, and seek professional advice where needed.
Fusion Media would like to remind you that the data contained in this website is not necessarily real-time nor accurate. The data and prices on the website are not necessarily provided by any market or exchange, but may be provided by market makers, and so prices may not be accurate and may differ from the actual price at any given market, meaning prices are indicative and not appropriate for trading purposes. Fusion Media and any provider of the data contained in this website will not accept liability for any loss or damage as a result of your trading, or your reliance on the information contained within this website.
It is prohibited to use, store, reproduce, display, modify, transmit or distribute the data contained in this website without the explicit prior written permission of Fusion Media and/or the data provider. All intellectual property rights are reserved by the providers and/or the exchange providing the data contained in this website.
Fusion Media may be compensated by the advertisers that appear on the website, based on your interaction with the advertisements or advertisers.
© 2007-2025 - Fusion Media Limited. All Rights Reserved.
