Teucrium When investing in agricultural commodities, an important factor to consider is the relatively predictable seasonal pricing patterns caused by harvest cycles and the opportunity that these patterns can create. These price patterns are often attributable to the influx of annual supply which occurs at each specific commodity’s harvest time. This once-per-year harvest, large or small, must meet demand throughout the crop year, since the supply cannot be increased until the next growing season is complete.
Cane sugar offers an example of how investors might consider both seasonal absolute pricing patterns and seasonal divergence from average annual pricing patterns to optimize trading and determine allocations of agricultural commodities in their portfolios.
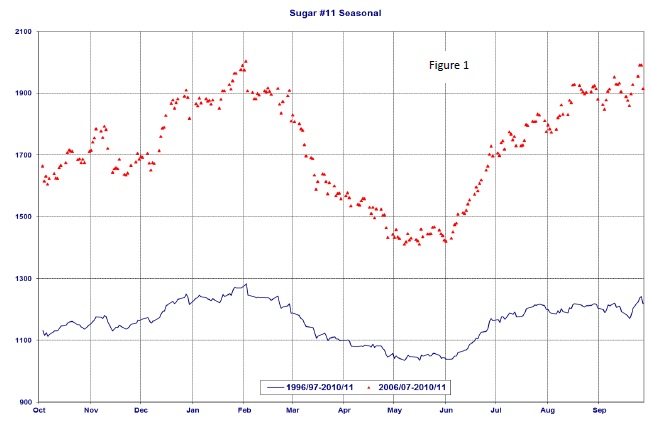
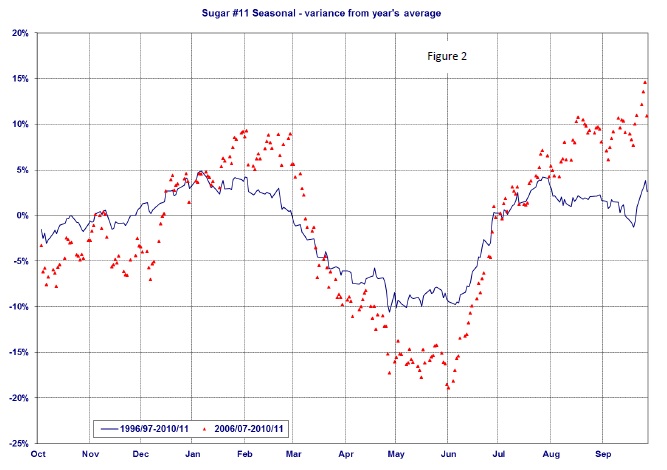
Due to the fundamental factors of weather and harvest cycles, as illustrated in the graphs below, the price of sugar often reaches its maximum low point between April and June. The low point generally coincides with peak harvest in Brazil, the world's largest exporter of sugar. In 2009, the leading producers of sugarcane were Brazil, India, Thailand and China, with Brazil producing nearly one-quarter of the world’s sugarcane. The harvest results in nearly a full year’s worth of supply coming to market in a short period of time (roughly 8-12 weeks). This influx of supply often, but not always, causes the absolute price of sugar to decline to its lowest point in its seasonal price cycle. It often also causes the price of sugar to fall (negatively diverge) below its average annual price, which can be important to asset allocators. Conversely, sugar often, but not always, reaches both its absolute price high and its widest positive divergence from annual average prices around February or September.

Source: NewEdge USA as of April 2012

Source: NewEdge USA as of April 2012
The charts above represent two aspects of the market’s seasonal pattern of prices for Front Month Sugar Futures Contracts – the most recent 15-year (solid line) and its most recent 5-year (dotted line), for the years 1996 to 2011, inclusive of the front month 2011 contracts. Thus, any evolution in the pattern may be perceived, as well as trends, and tops and bottoms coincident to both. In Figure 1, the index on the left represents the price of a unit of #11 Sugar in cents per pound (1700 = $0.17). In Figure 2, the index on the left represents the percent variance from the annual average price in cents per pound. Past performance is not an indicator of future results. Graph does not represent any indication that futures or funds will achieve similar results.
To accommodate this once-per-year harvest, the markets create price structures which encourage storage and gradual release into the marketplace to meet relatively inelastic demand. Global markets build in carrying charges or contango1 structures into market prices. This structure encourages the producer or commercial entities to store excess supplies, thereby making supplies available ratably into the future as well as at harvest time.
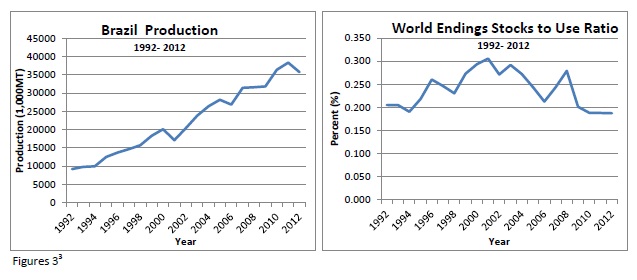
The charts below (Figures 3) illustrate that increasing global sugar demand has caused a decline in the World Ending Stocks-to-Use ratio of sugar, even while Brazilian production continues to rise. The Ending Stocks-to-Use ratio is a measure of excess supplies of a given commodity after accounting for prior end-of-year inventory, new supplies harvested, and usage over an entire crop year. In general the lower Ending Stocks-to-Use ratio becomes, the less tolerance there is for crop failures or supply disruptions for the upcoming crop year.
Because basic agricultural commodities have both relatively inelastic demand (compared to the more discretionary goods) and supplies that must be replenished annually, the Ending Stocks-to-Use ratio is a particularly important analysis metric within the commodity sector. Between 2009 and (USDA estimates for) 2012, the Ending Stocks-to-Use ratios for sugar worldwide is projected to decline to a 20-year low, to about 18.8%2. Part of the challenge since 2010 has been adverse harvest conditions for the world’s largest producer, Brazil. Whether we see a below average or above average crop size, the sugar market’s reliance upon a once-per-year re-supply at harvest causes seasonality to remain fairly constant.

Source: United States Department of Agriculture
Even with this tightening of world and Brazilian supply, seasonality of sugar prices continues to hold to its long-term pattern, with the most concentrated bottoming of prices during harvest, which ranges from April through June (shown in Figure 1). Depending on the dynamics of the sugar cane harvest in the Southern Hemisphere, we can see a post-harvest peak in September, a fall-off in prices going into year end and a second peak in February before the harvest cycle begins again. Investors, aware of these fundamental characteristics of the sugar markets, may be able to use these historical seasonal patterns to trade sugar more efficiently within their portfolios.
In summary, generally look for sugar to bottom in the April-June period or peak during September or February. The market will continue to offer opportunity for the investor to overweight or even underweight investments in the sugar market. The Teucrium Sugar Fund (NYSE: “CANE”) offers investors liquid, transparent, unleveraged access to sugar markets in an Exchange Traded Product (ETP) format. The investment objective of the Fund is to have the daily changes in percentage terms of the Shares’ Net Asset Value (“NAV”) reflect the daily changes in percentage terms of a weighted average of the closing settlement prices for three futures contracts for sugar (“Sugar Futures Contracts”) that are traded on ICE Futures US (“ICE Futures”), specifically: (1) the second-to-expire Sugar No. 11 Futures Contract (a “Sugar No. 11 Futures Contract”), weighted 35%, (2) the third-to-expire Sugar No. 11 Futures Contract, weighted 30%, and (3) the Sugar No. 11 Futures Contract expiring in the March following the expiration month of the third-to-expire contract, weighted 35%.
Teucrium cannot guarantee that the information contained here-in is updated for future publications.
The views in this newsletter were those of Teucrium Trading, LLC as of May 11, 2012 and may not reflect the views of Teucrium on the date the material is first published or any time thereafter. These views are intended to assist readers in understanding commodities and do not constitute investment advice. This should not be considered as an offer to see or a solicitation of an offer to buy any securities mentioned herein.
The Teucrium Funds have a limited operating history, meaning there is little performance history that might serve as a basis to evaluate an investment in the Trust. Investing in a Fund subjects an investor to the risks of the applicable commodity market, which investment could result in substantial fluctuations in the price of Fund shares. Unlike mutual funds, the Funds generally will not distribute dividends to shareholders. The Sponsor has limited experience operating commodity pools; a commodity pool is defined as an enterprise in which several individuals contribute funds in order to trade futures or futures options collectively. Investors may choose to use a Fund as a vehicle to hedge against the risk of loss, and there are risks involved in hedging activities. Commodities and futures generally are volatile and are not suitable for all investors. The Funds are not mutual funds or any other type of Investment Company within the meaning of the Investment Company Act of 1940, as amended, and are not subject to regulation thereunder. For a complete description of the risks associated with the Funds, please refer to the applicable prospectus.
Shares of the Funds are not FDIC insured, may lose value, and have no bank guarantee.
Foreside Fund Services, LLC is the distributor for the Teucrium Funds.
The Teucrium Funds have a patent pending on the methodology employed by the Funds.
A copy of the prospectus for Teucrium Cane Sugar Fund and Teucrium Agricultural Fund may be accessed at the links below:
Cane sugar offers an example of how investors might consider both seasonal absolute pricing patterns and seasonal divergence from average annual pricing patterns to optimize trading and determine allocations of agricultural commodities in their portfolios.
Due to the fundamental factors of weather and harvest cycles, as illustrated in the graphs below, the price of sugar often reaches its maximum low point between April and June. The low point generally coincides with peak harvest in Brazil, the world's largest exporter of sugar. In 2009, the leading producers of sugarcane were Brazil, India, Thailand and China, with Brazil producing nearly one-quarter of the world’s sugarcane. The harvest results in nearly a full year’s worth of supply coming to market in a short period of time (roughly 8-12 weeks). This influx of supply often, but not always, causes the absolute price of sugar to decline to its lowest point in its seasonal price cycle. It often also causes the price of sugar to fall (negatively diverge) below its average annual price, which can be important to asset allocators. Conversely, sugar often, but not always, reaches both its absolute price high and its widest positive divergence from annual average prices around February or September.

Source: NewEdge USA as of April 2012

Source: NewEdge USA as of April 2012
The charts above represent two aspects of the market’s seasonal pattern of prices for Front Month Sugar Futures Contracts – the most recent 15-year (solid line) and its most recent 5-year (dotted line), for the years 1996 to 2011, inclusive of the front month 2011 contracts. Thus, any evolution in the pattern may be perceived, as well as trends, and tops and bottoms coincident to both. In Figure 1, the index on the left represents the price of a unit of #11 Sugar in cents per pound (1700 = $0.17). In Figure 2, the index on the left represents the percent variance from the annual average price in cents per pound. Past performance is not an indicator of future results. Graph does not represent any indication that futures or funds will achieve similar results.
To accommodate this once-per-year harvest, the markets create price structures which encourage storage and gradual release into the marketplace to meet relatively inelastic demand. Global markets build in carrying charges or contango1 structures into market prices. This structure encourages the producer or commercial entities to store excess supplies, thereby making supplies available ratably into the future as well as at harvest time.
The charts below (Figures 3) illustrate that increasing global sugar demand has caused a decline in the World Ending Stocks-to-Use ratio of sugar, even while Brazilian production continues to rise. The Ending Stocks-to-Use ratio is a measure of excess supplies of a given commodity after accounting for prior end-of-year inventory, new supplies harvested, and usage over an entire crop year. In general the lower Ending Stocks-to-Use ratio becomes, the less tolerance there is for crop failures or supply disruptions for the upcoming crop year.
Because basic agricultural commodities have both relatively inelastic demand (compared to the more discretionary goods) and supplies that must be replenished annually, the Ending Stocks-to-Use ratio is a particularly important analysis metric within the commodity sector. Between 2009 and (USDA estimates for) 2012, the Ending Stocks-to-Use ratios for sugar worldwide is projected to decline to a 20-year low, to about 18.8%2. Part of the challenge since 2010 has been adverse harvest conditions for the world’s largest producer, Brazil. Whether we see a below average or above average crop size, the sugar market’s reliance upon a once-per-year re-supply at harvest causes seasonality to remain fairly constant.

Source: United States Department of Agriculture
Even with this tightening of world and Brazilian supply, seasonality of sugar prices continues to hold to its long-term pattern, with the most concentrated bottoming of prices during harvest, which ranges from April through June (shown in Figure 1). Depending on the dynamics of the sugar cane harvest in the Southern Hemisphere, we can see a post-harvest peak in September, a fall-off in prices going into year end and a second peak in February before the harvest cycle begins again. Investors, aware of these fundamental characteristics of the sugar markets, may be able to use these historical seasonal patterns to trade sugar more efficiently within their portfolios.
In summary, generally look for sugar to bottom in the April-June period or peak during September or February. The market will continue to offer opportunity for the investor to overweight or even underweight investments in the sugar market. The Teucrium Sugar Fund (NYSE: “CANE”) offers investors liquid, transparent, unleveraged access to sugar markets in an Exchange Traded Product (ETP) format. The investment objective of the Fund is to have the daily changes in percentage terms of the Shares’ Net Asset Value (“NAV”) reflect the daily changes in percentage terms of a weighted average of the closing settlement prices for three futures contracts for sugar (“Sugar Futures Contracts”) that are traded on ICE Futures US (“ICE Futures”), specifically: (1) the second-to-expire Sugar No. 11 Futures Contract (a “Sugar No. 11 Futures Contract”), weighted 35%, (2) the third-to-expire Sugar No. 11 Futures Contract, weighted 30%, and (3) the Sugar No. 11 Futures Contract expiring in the March following the expiration month of the third-to-expire contract, weighted 35%.
Teucrium cannot guarantee that the information contained here-in is updated for future publications.
The views in this newsletter were those of Teucrium Trading, LLC as of May 11, 2012 and may not reflect the views of Teucrium on the date the material is first published or any time thereafter. These views are intended to assist readers in understanding commodities and do not constitute investment advice. This should not be considered as an offer to see or a solicitation of an offer to buy any securities mentioned herein.
The Teucrium Funds have a limited operating history, meaning there is little performance history that might serve as a basis to evaluate an investment in the Trust. Investing in a Fund subjects an investor to the risks of the applicable commodity market, which investment could result in substantial fluctuations in the price of Fund shares. Unlike mutual funds, the Funds generally will not distribute dividends to shareholders. The Sponsor has limited experience operating commodity pools; a commodity pool is defined as an enterprise in which several individuals contribute funds in order to trade futures or futures options collectively. Investors may choose to use a Fund as a vehicle to hedge against the risk of loss, and there are risks involved in hedging activities. Commodities and futures generally are volatile and are not suitable for all investors. The Funds are not mutual funds or any other type of Investment Company within the meaning of the Investment Company Act of 1940, as amended, and are not subject to regulation thereunder. For a complete description of the risks associated with the Funds, please refer to the applicable prospectus.
Shares of the Funds are not FDIC insured, may lose value, and have no bank guarantee.
Foreside Fund Services, LLC is the distributor for the Teucrium Funds.
The Teucrium Funds have a patent pending on the methodology employed by the Funds.
A copy of the prospectus for Teucrium Cane Sugar Fund and Teucrium Agricultural Fund may be accessed at the links below:
